AX1828
Using the Report Builder, you can create and edit web reports using a drag-and-drop interface. Web reports are intended to be intuitive for report builders to create and easy for report viewers to use.
Web reports support two different ways to display reporting data in a grid:
- Dynamic rows: Dynamically display data rows based on a specified dimension or grouping.
- Fixed rows: Use predefined fixed row structures to organize data rows into sections with headers, totals, and subtotals.
The Report Builder opens when you do either of the following:
- Create a new web report from the Report Center.
- Edit an existing web report from the Report Center.
Overview of Report Builder
The Report Builder has three main areas:
-
The Data Panel on the left side is where you select the data to include in your report.
-
The Report Canvas in the middle is where you build the report. Columns can be dragged and dropped from the Data Panel to the Report Canvas. You can also create calculations to display in the report columns, and define column groups.
-
The Configuration Panel on the right side is where you define properties for the report, the data grid, and the individual columns. You can configure properties such as report titles, drilling and filtering options, and column formatting.
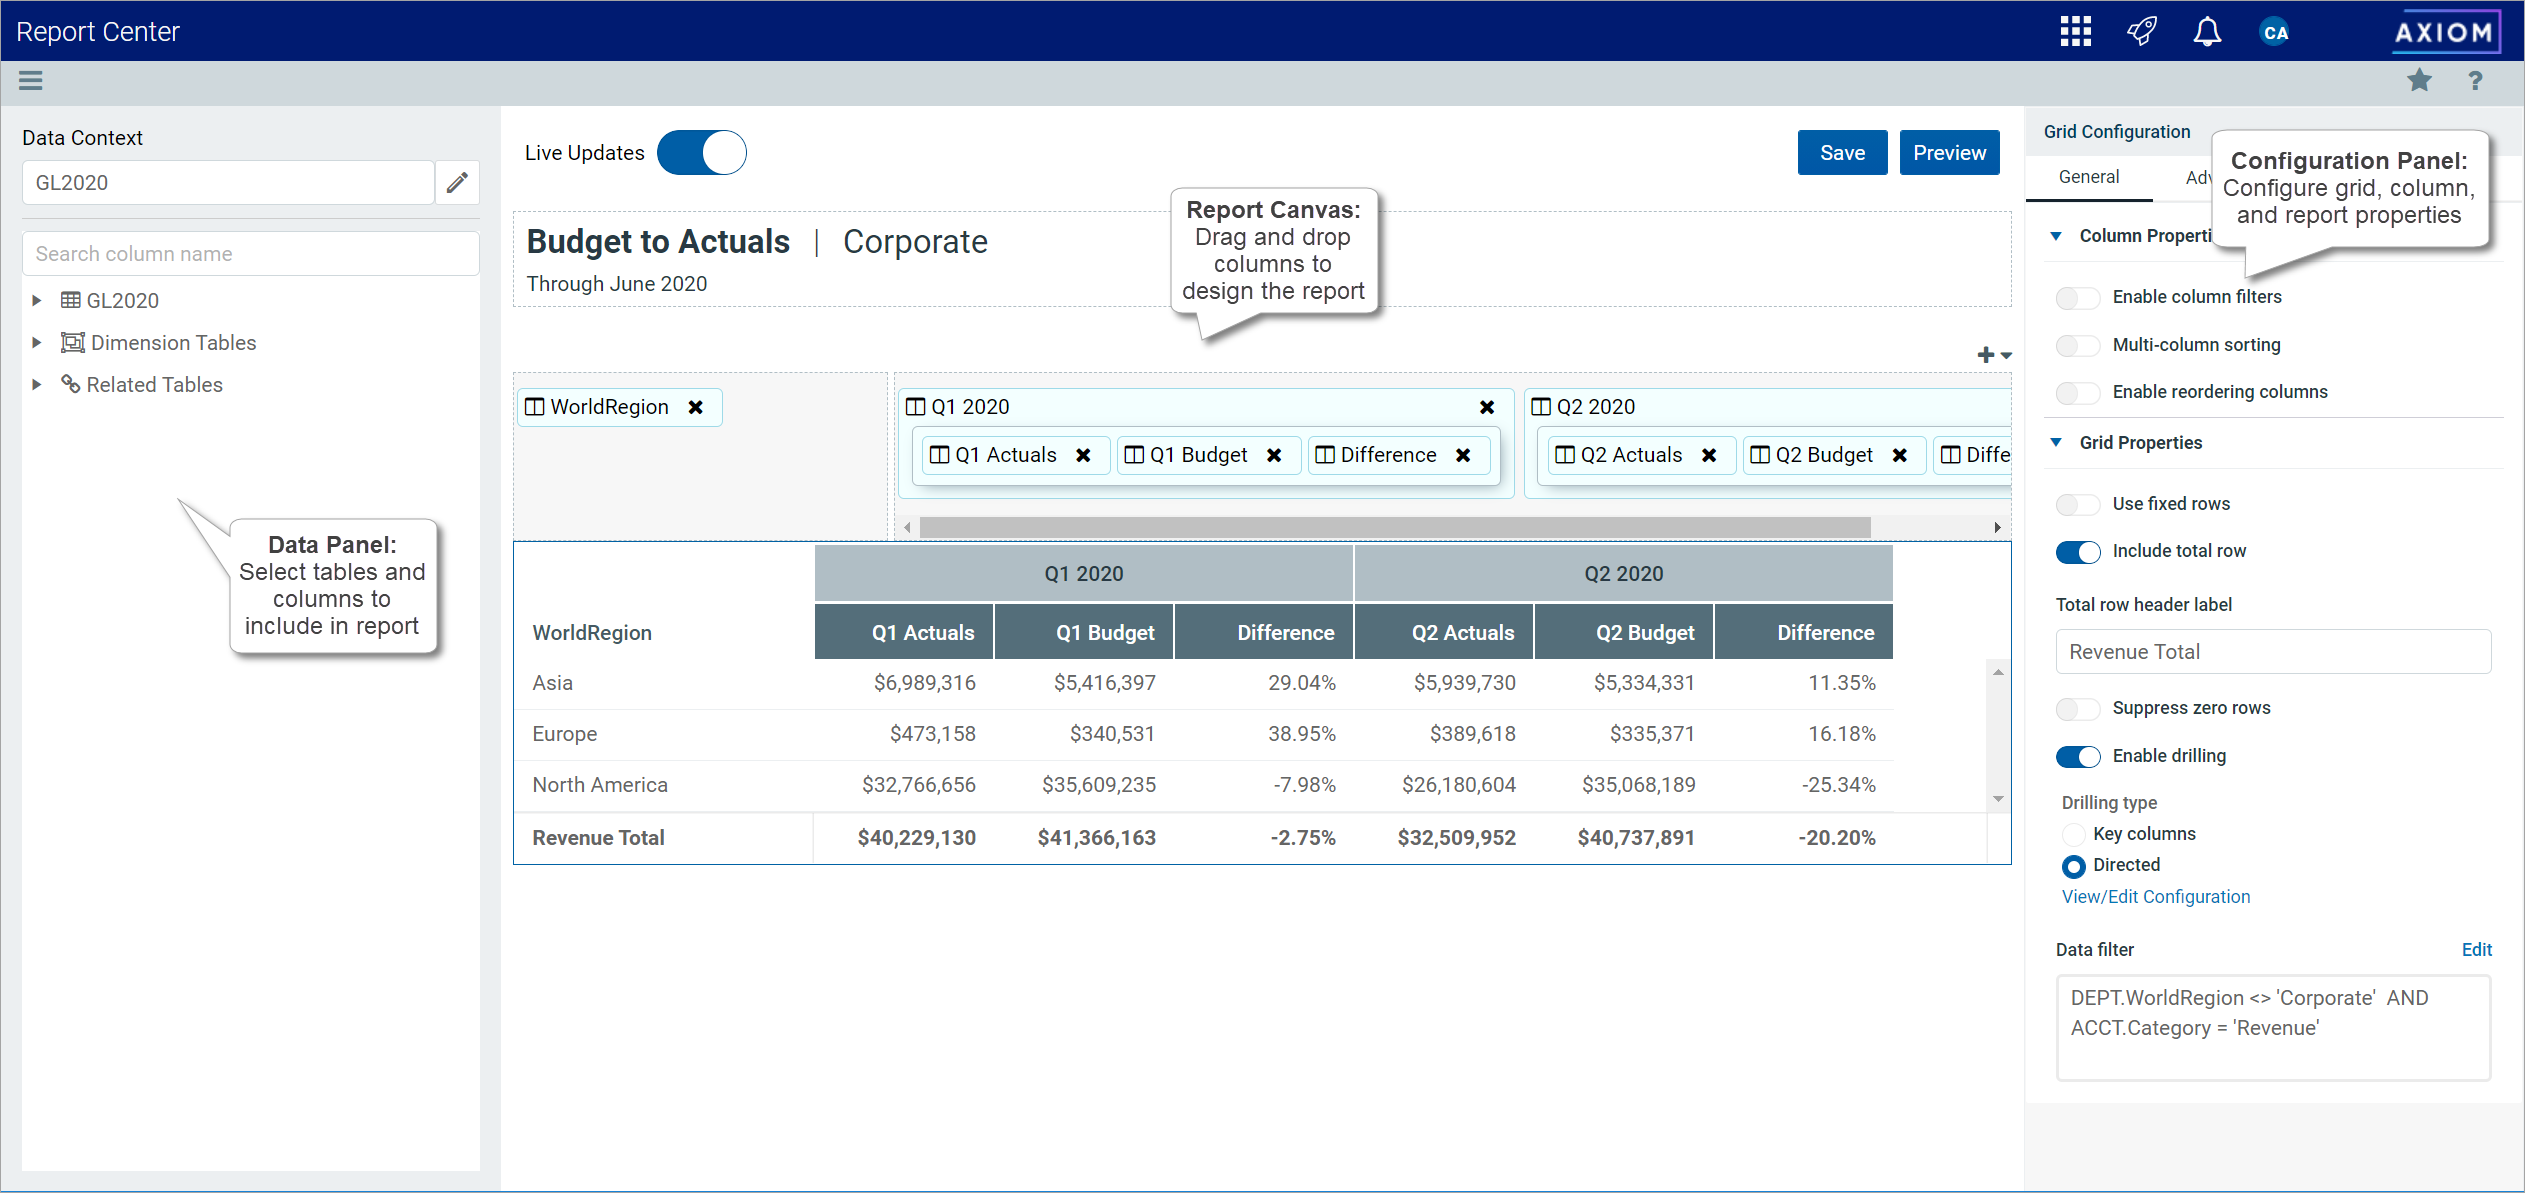
Overview of the Report Builder
As you build and configure the report, a limited preview of the grid displays in the Report Canvas area, so that you can see the effect of your choices in real time. If you want to work on the report without this live update, you can disable the Live Updates toggle at the top of the canvas. When live updates are disabled, a new Apply Changes button displays at the top of the canvas. You can use this button to manually refresh the preview (or you can re-enable Live Updates).
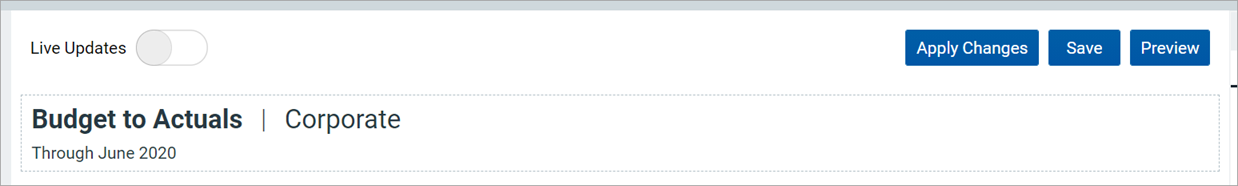
Report Builder with Live Updates disabled
Building a report in the Report Builder
The following is an overview of how to build a report in the Report Builder:
-
Define a data context: Each report must have a specified primary table to determine the data context for the report. Once the data context is defined, you can build the report using columns from the primary table and from related tables.
-
Define the grid rows: Web reports can use dynamically generated rows based on a dimension, or they can use a fixed row structure. Do one of the following depending on the type of report that you want to make:
-
For dynamic rows, add a row dimension to the grid by dragging and dropping a table column.
-
For fixed rows, specify a fixed row structure by modifying the grid properties.
-
-
Add data columns and calculated columns: Drag and drop table columns out to the grid to define the data columns for the report, and define calculated columns as needed. You can also define column groups to create grouped headers in the report.
-
Configure report properties: Define report title text and an optional report description.
-
Configure grid properties: Configure grid properties such as a data filter and user interaction options. This includes enabling and configuring drilling options as needed.
-
Configure column properties: Configure properties for each column such as alignment, width, number format, and column filters.
Previewing a report
Although the grid shown in the Report Canvas updates in response to report configuration changes made in the Report Builder, it is not intended to be a fully live representation of the report. If you want to see how the report will appear to end users without leaving the Report Builder, click the Preview button at the top of the Report Canvas.
The report preview opens in a separate dialog that overlays the Report Builder. Using this preview, you can try out end-user features like sorting, filtering, and drilling the report. When you are done viewing the preview, click Close at the bottom of the dialog to return to the Report Builder.
NOTE: If you drill the report preview, the drill results open in a new browser tab.
Saving a report
Use the Save button at the top of the Report Canvas to save the report. If the report is a brand new report, you will be prompted to define a name and folder location for the report. Otherwise, the existing report is saved.
If you have made changes to the report but have not yet saved, you will be prompted to save when you attempt to close the browser tab or navigate to a new location.
NOTE: Currently, it is not possible to "save as" in the Report Builder. If you want to create a copy of an existing web report, you must use Axiom Explorer in the Desktop Client to copy the file.
