AX1838
Using the Report Center, you can create new web reports from scratch so that you can build the report as needed.
In order to create a web report, you must be an administrator or have the Create Web Reports security permission. You must also have read/write access to at least one folder in the Reports Library. If you do not have permission to create web reports, then the option to create a new web report will not be available from the Create button in the Report Center. If the Create button does not have any available options to display, then the button is hidden entirely.
To create a new web report:
-
In the Report Center, click Create > New web report.
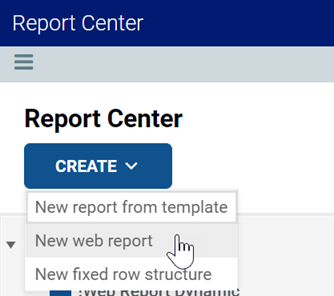
The Report Builder opens in a new tab, displaying a new blank report.
-
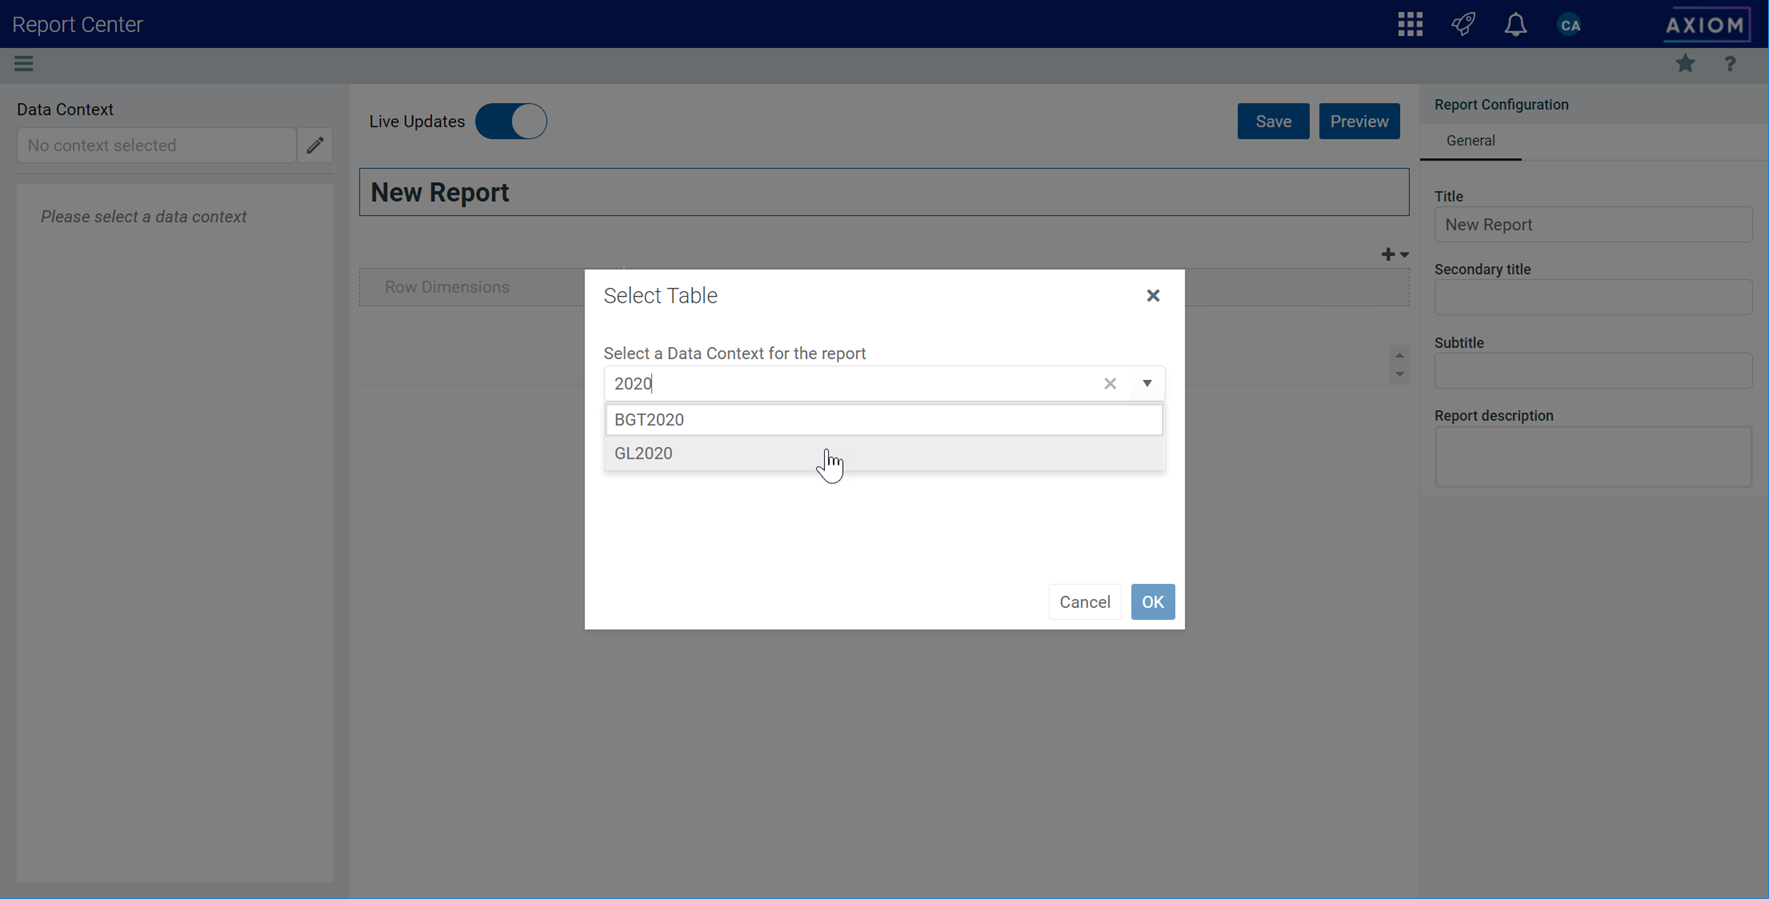
In the Select Table dialog, select a primary table to determine the data context for the report, then click OK.
You can select a table from the drop-down list directly, or type into the box to search for a table name. The search uses "contains" matching to return any tables that contain the search text within the table name. In the following screenshot, the text
2020has been used to search for tables with the year 2020 in the name.The data context determines the overall pool of data that is eligible to be included in the report. The selected primary table determines which other tables are eligible for inclusion in the report, based on lookup relationships. All table columns and filters used in the report must be compatible in the context of the primary table.
Although you can click Cancel if you are not ready to select a primary table for the data context, most activities in the Report Builder require a data context to be selected.
Once a table is selected for the data context, you can work with the report in the Report Builder. The Report Builder consists of three main areas as follows:
-
The Data Panel on the left side is where you select the data to include in your report.
-
The Report Canvas in the middle is where you build the report. Columns can be dragged and dropped from the Data Panel to the Report Canvas. You can also create calculations to display in the report columns, and define column groups.
-
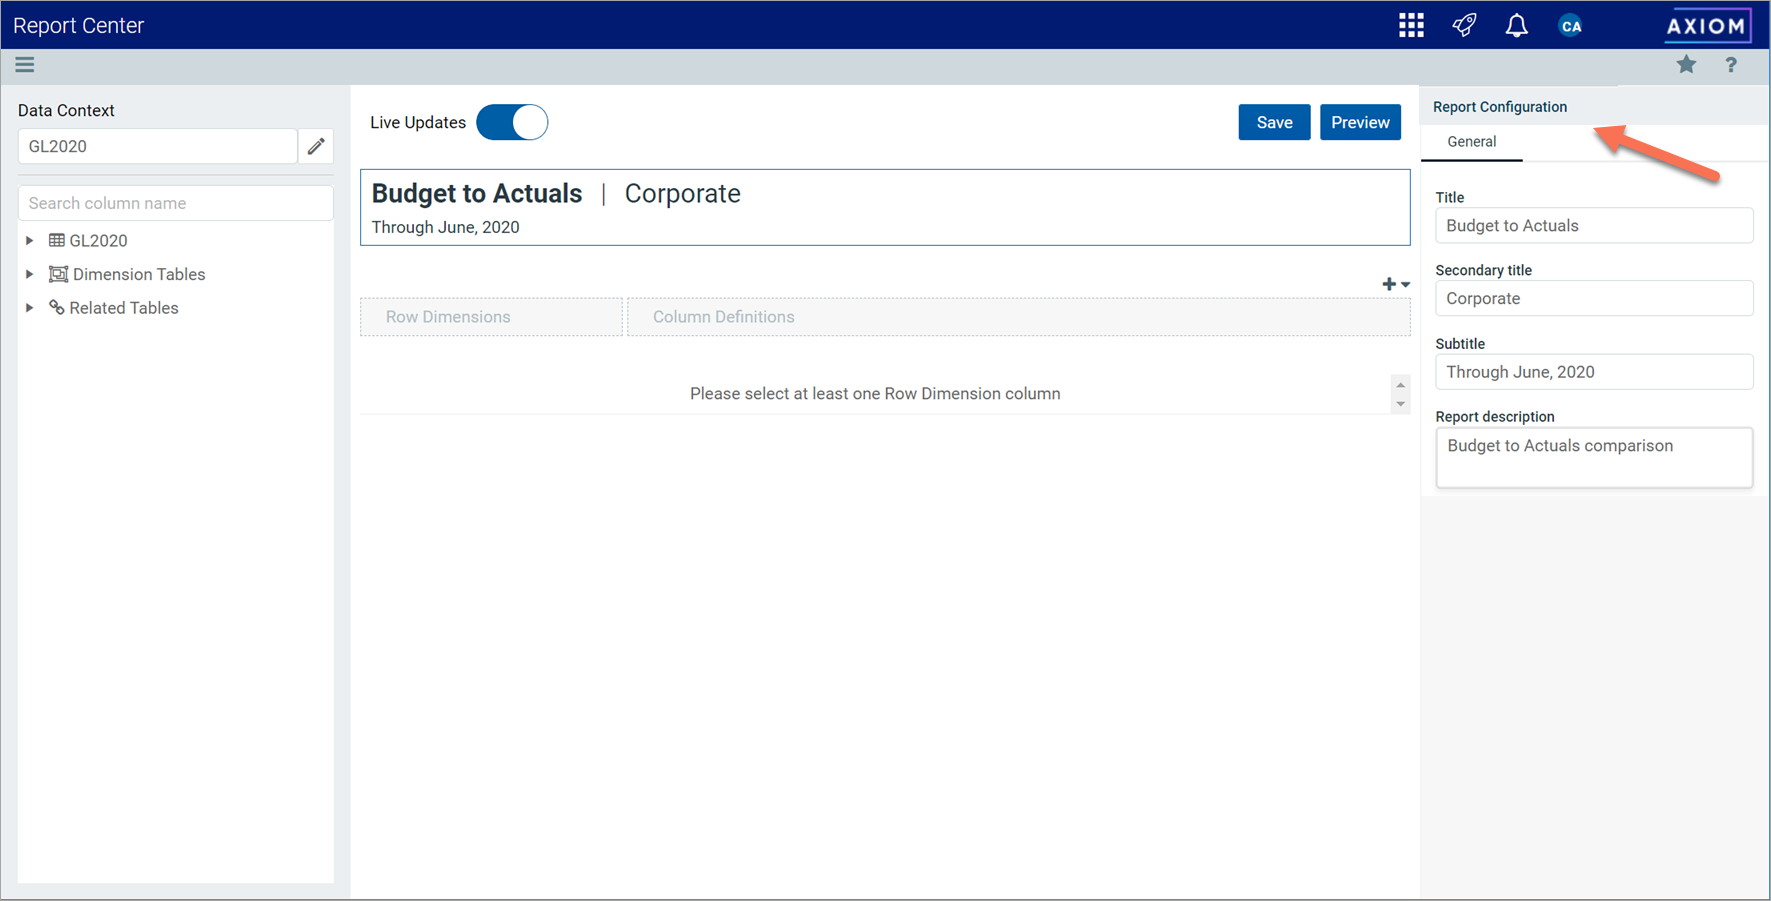
The Configuration Panel on the right side is where you define properties for the report, the data grid, and the individual columns. You can configure properties such as report titles, drilling and filtering options, and column formatting.
For more information on using the Report Builder, see Using the Report Builder.
-
-
In the Report Configuration panel along the right side of the page, define the report titles and description as needed. For more information, see Configuring report properties for a web report.
-
Define the rows of the report by doing one of the following, depending on whether you want to generate the rows dynamically or use a fixed row structure:
-
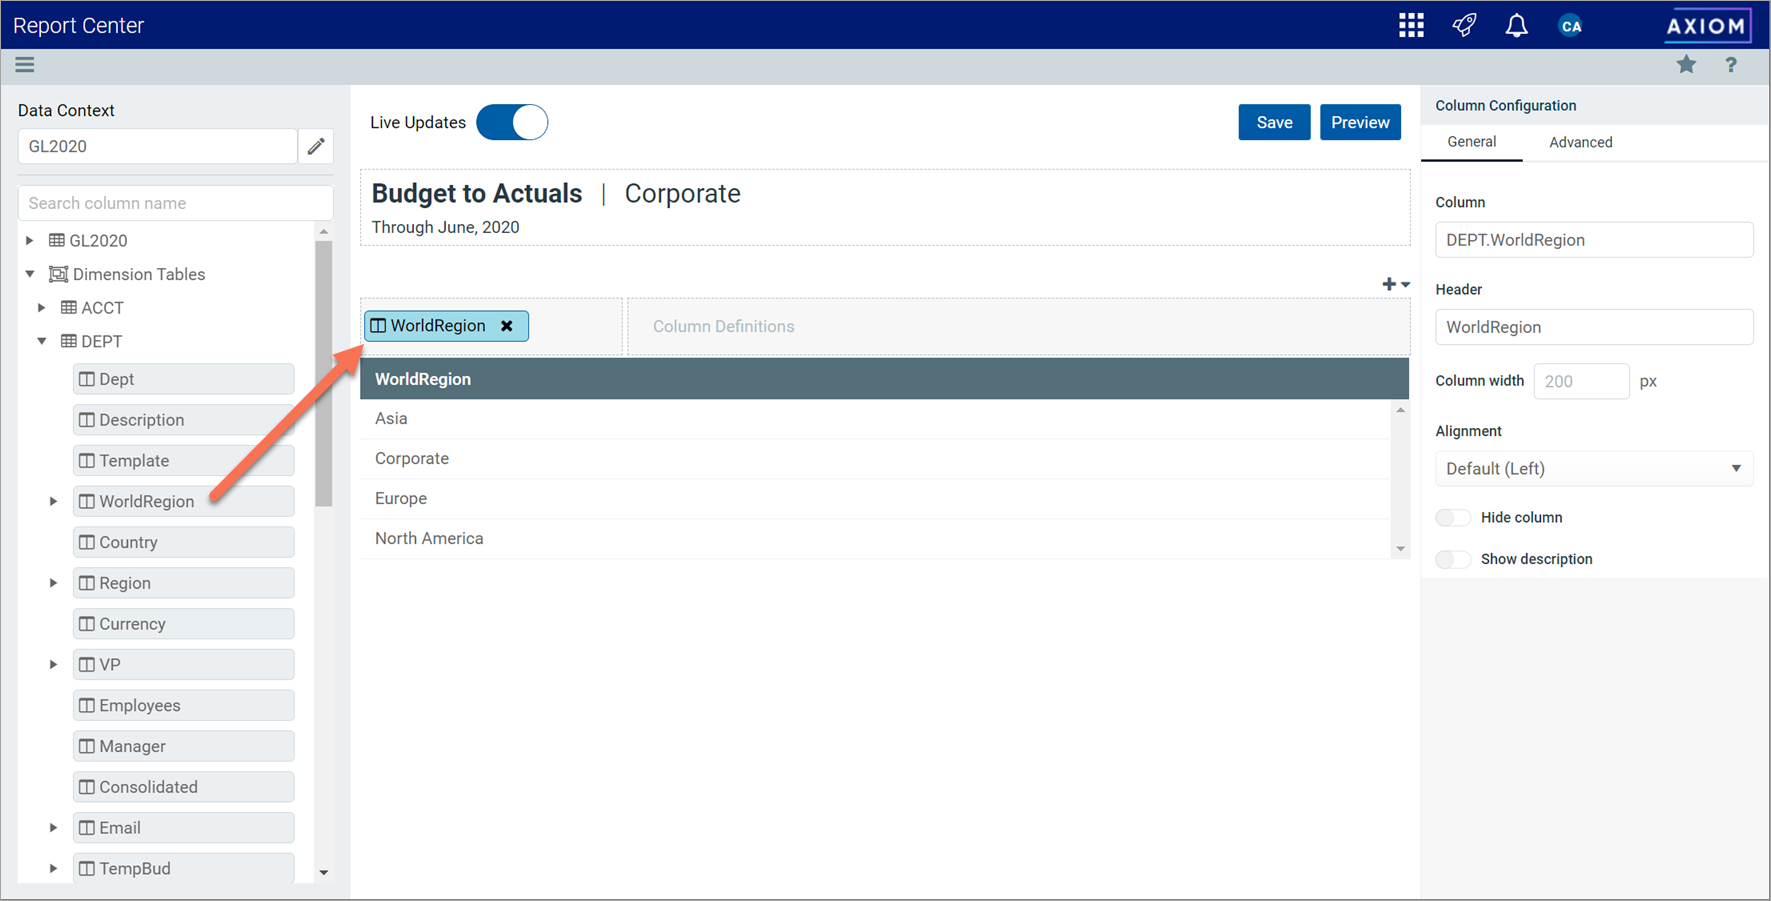
Dynamic rows: In the Data Panel, locate the table column that you want to use as the row dimension. Drag and drop the column to the Row Dimensions box in the Report Canvas.
Once you drag and drop a column to use as a row dimension, the rows of the report dynamically populate based on the values in that column. For more information, see Specifying the row dimension for a web report.
-
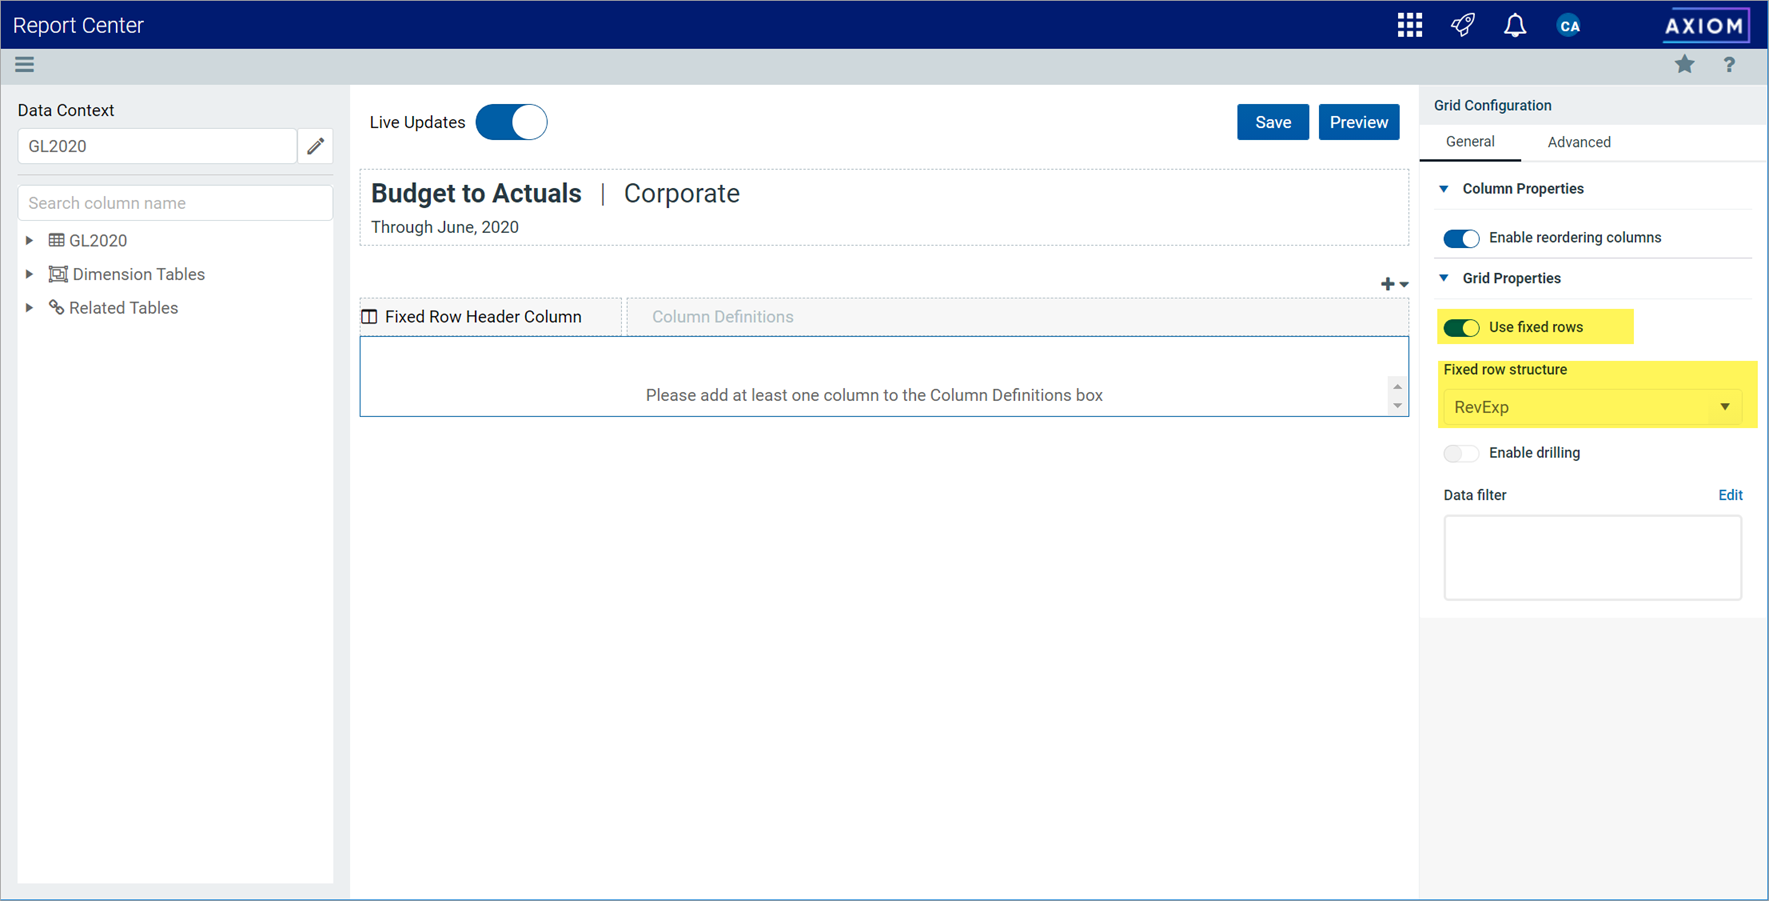
Fixed rows: Select the placeholder text in the Report Canvas so that the Grid Configuration properties load into the Configuration Panel. On the General tab, enable Use fixed rows then select an existing Fixed row structure. For more information, see Specifying the fixed row structure for a web report.
In this case, the rows will not load into the Report Canvas area until at least one data column is added to the Column Definitions box.
-
-
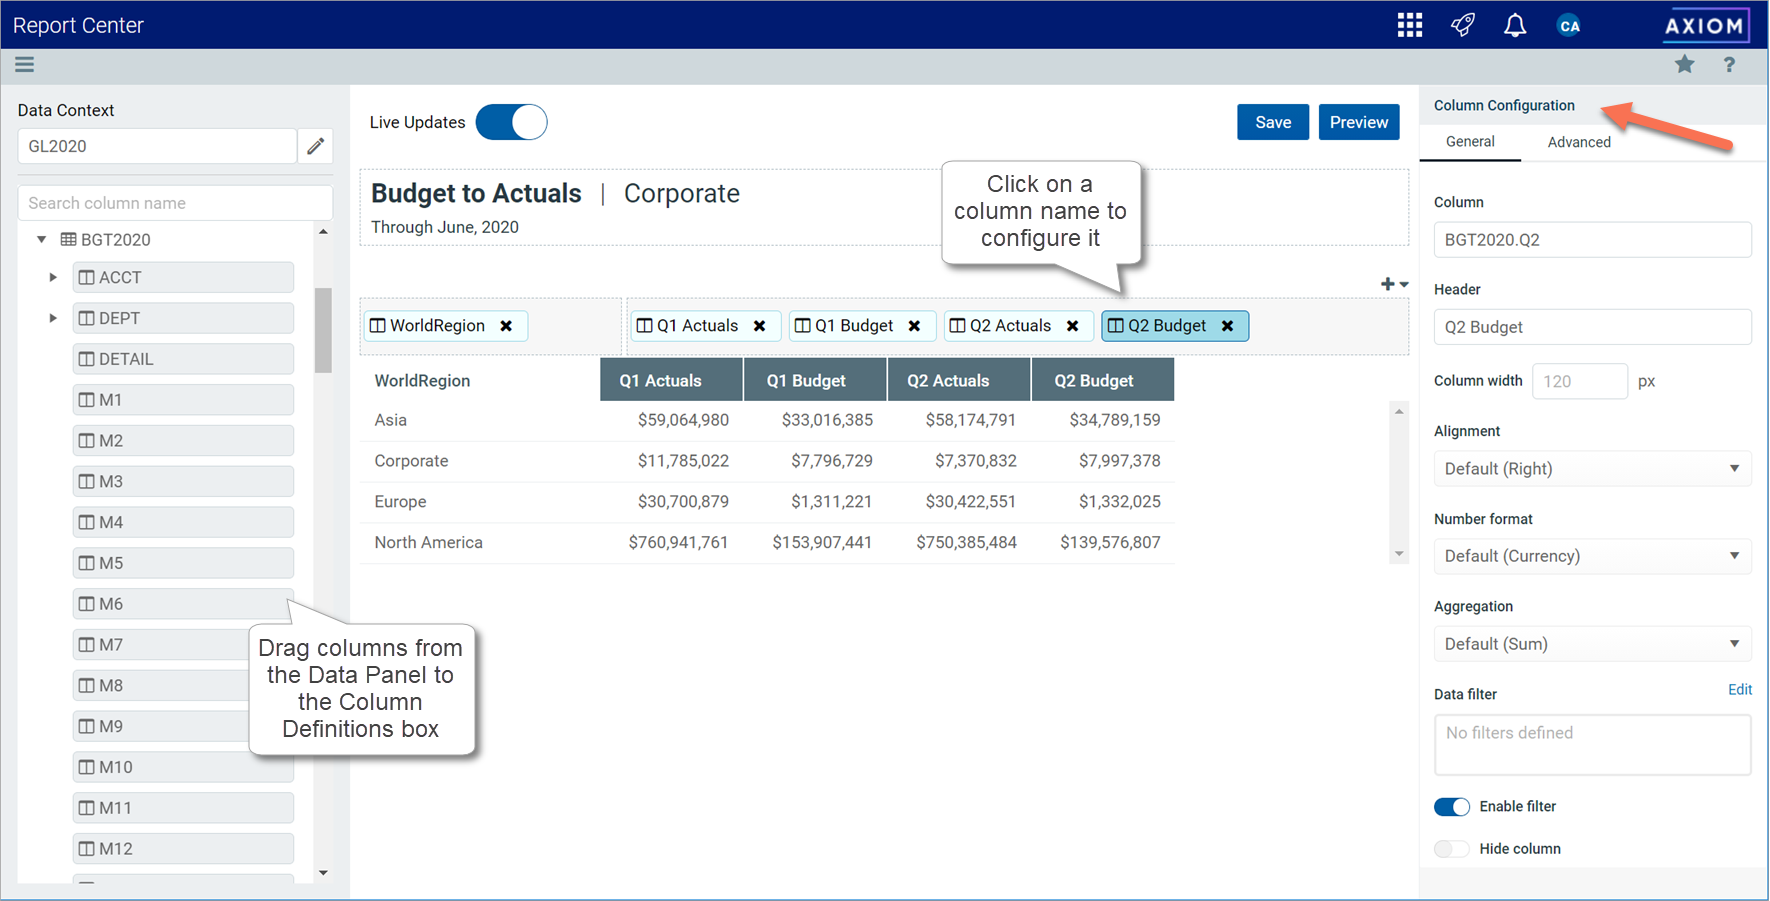
Use the Data Panel to locate the data columns that you want to display in the report, then drag and drop those columns out to the Column Definitions box in the Report Canvas. Once the columns are added to the grid, you can configure data and display properties for each column.
For more information, see Adding data columns and calculated columns to a web report and Configuring column properties for a web report.
-
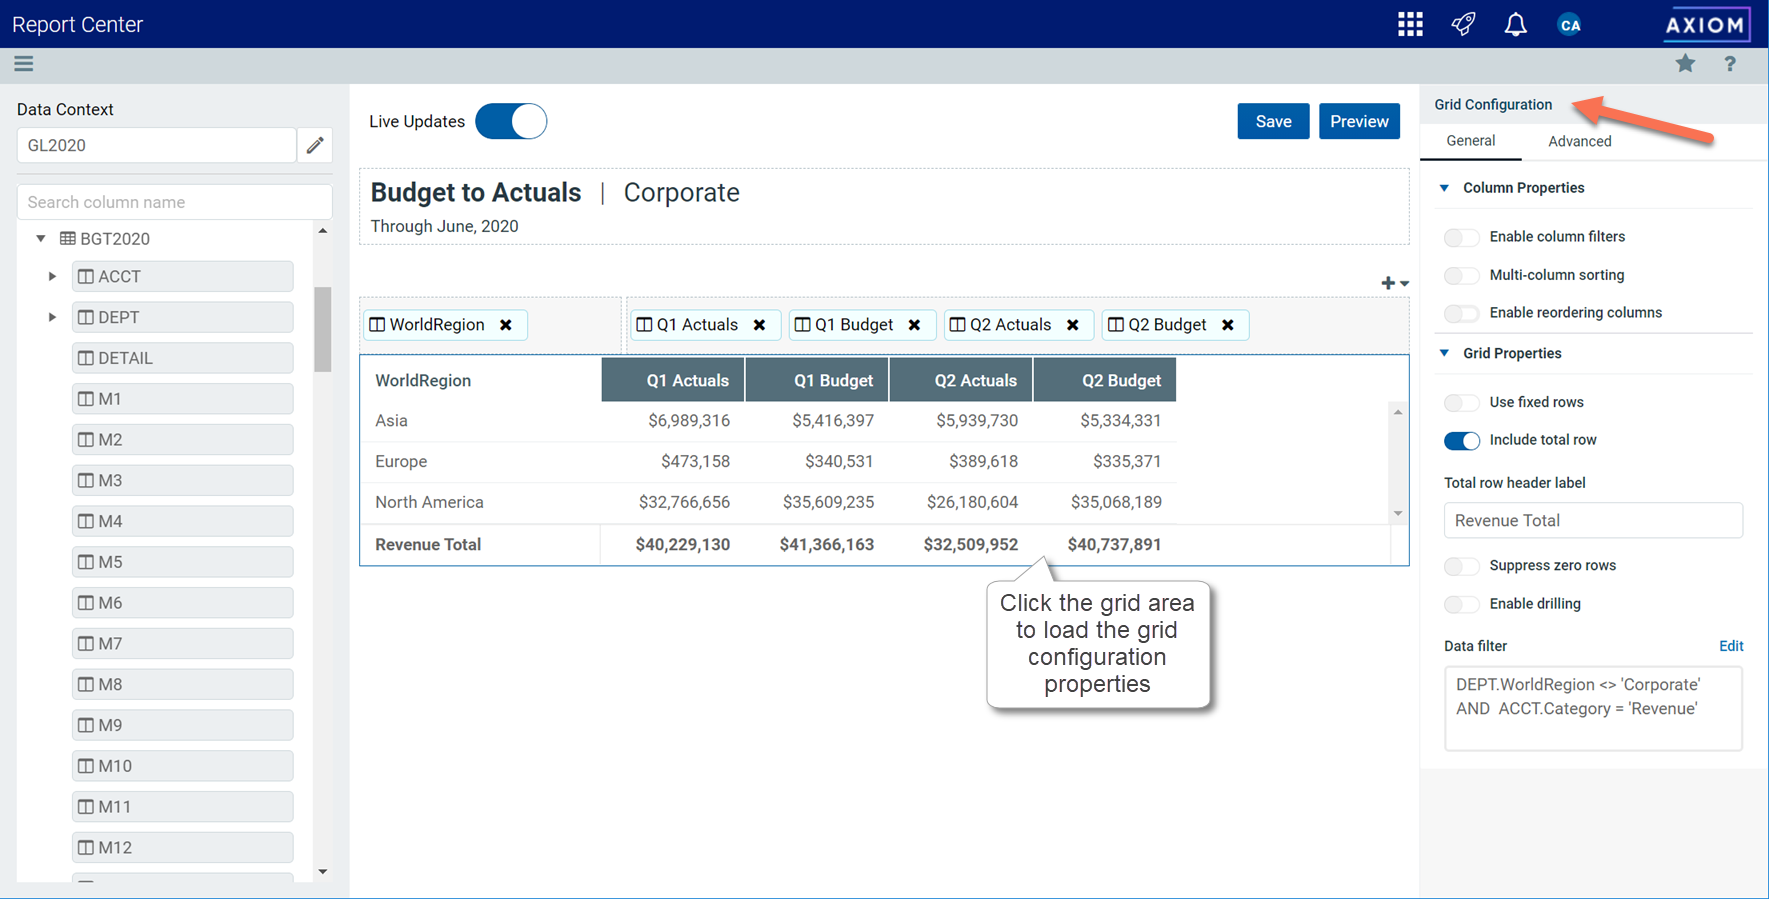
Select the grid in the report canvas so that the configuration panel changes to show the Grid Configuration settings. Define the grid settings as needed, such as to enable the total row, or define a data filter, or enable drilling options. For more information, see Configuring grid properties in a web report.
In the following example, a filter has been defined for the grid which affects both the data displayed in the report and the row values. Additionally, the total row was enabled.
-
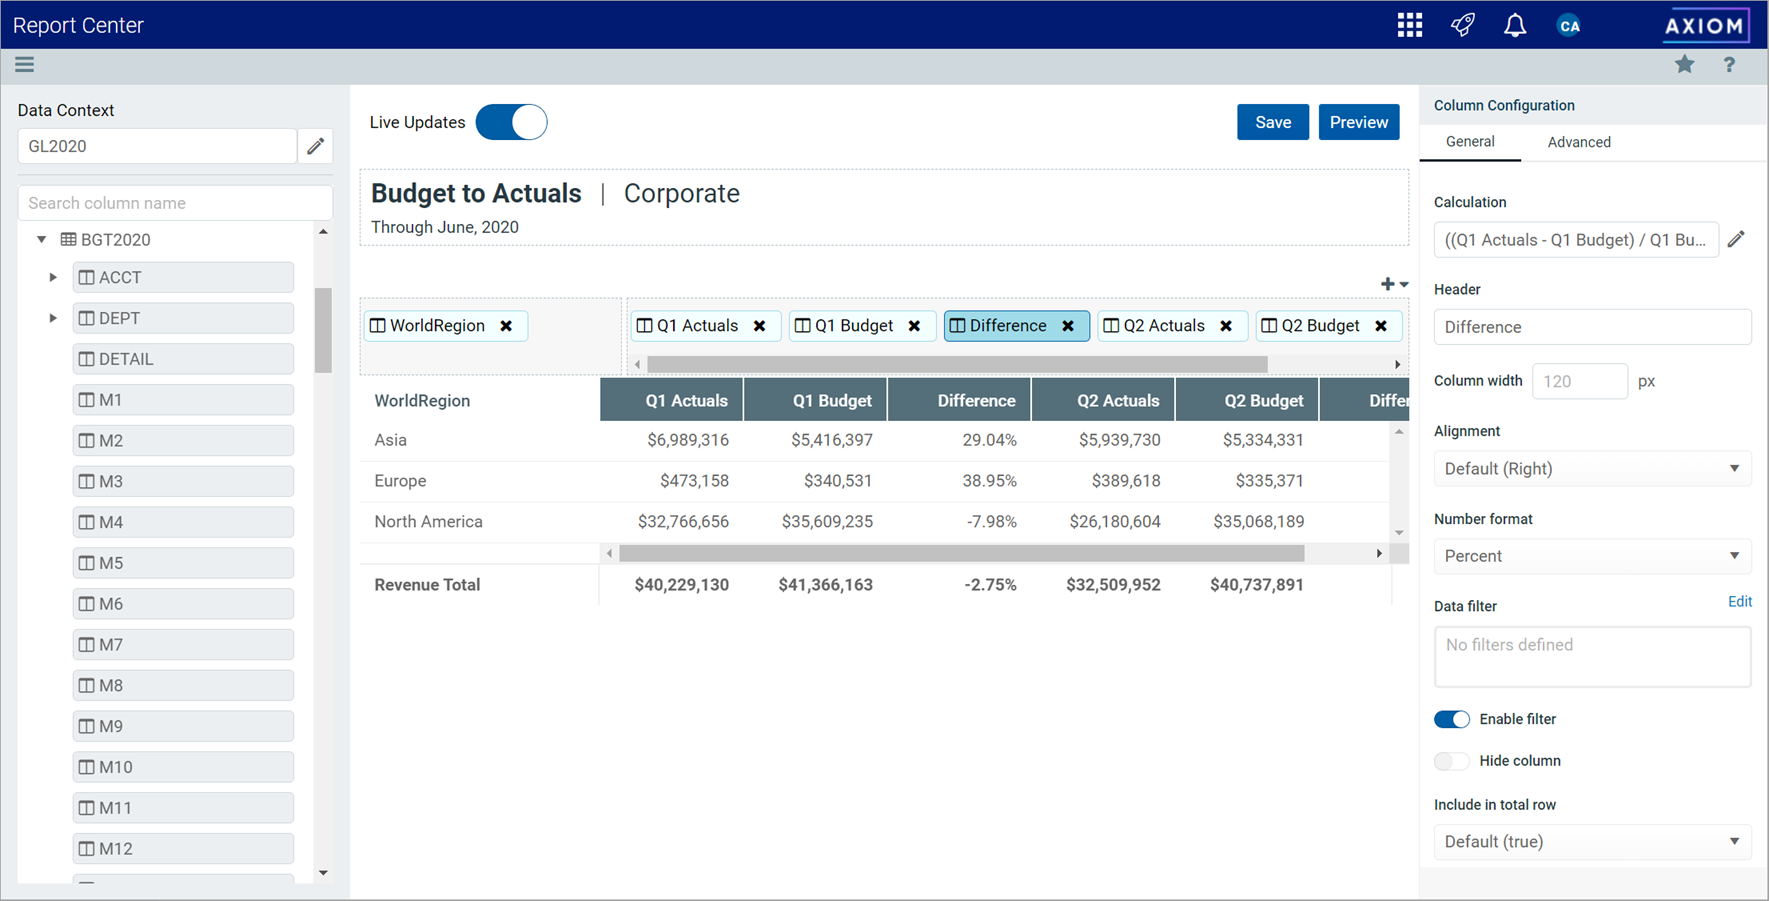
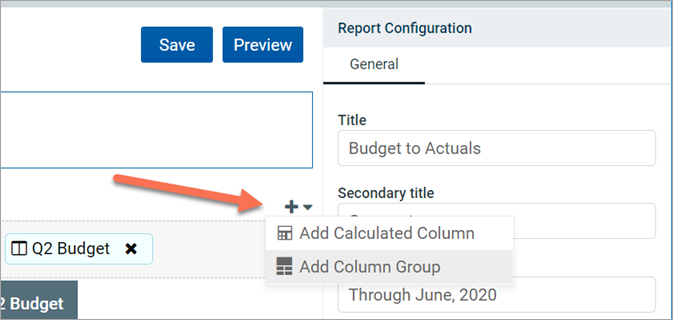
Use the plus icon at the top right of the Column Definitions box to add calculated columns to the grid as needed. For more information, see Adding data columns and calculated columns to a web report.
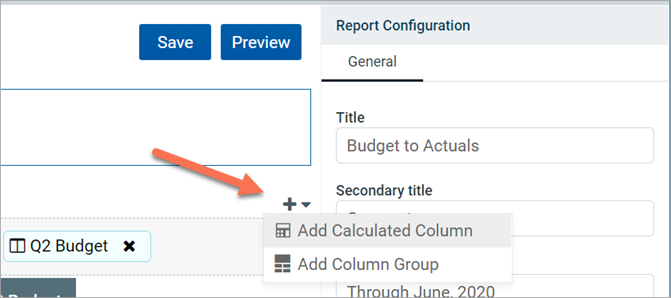
In the following example, two calculated columns have been added to calculate the difference between actuals and budget for each quarter.
-
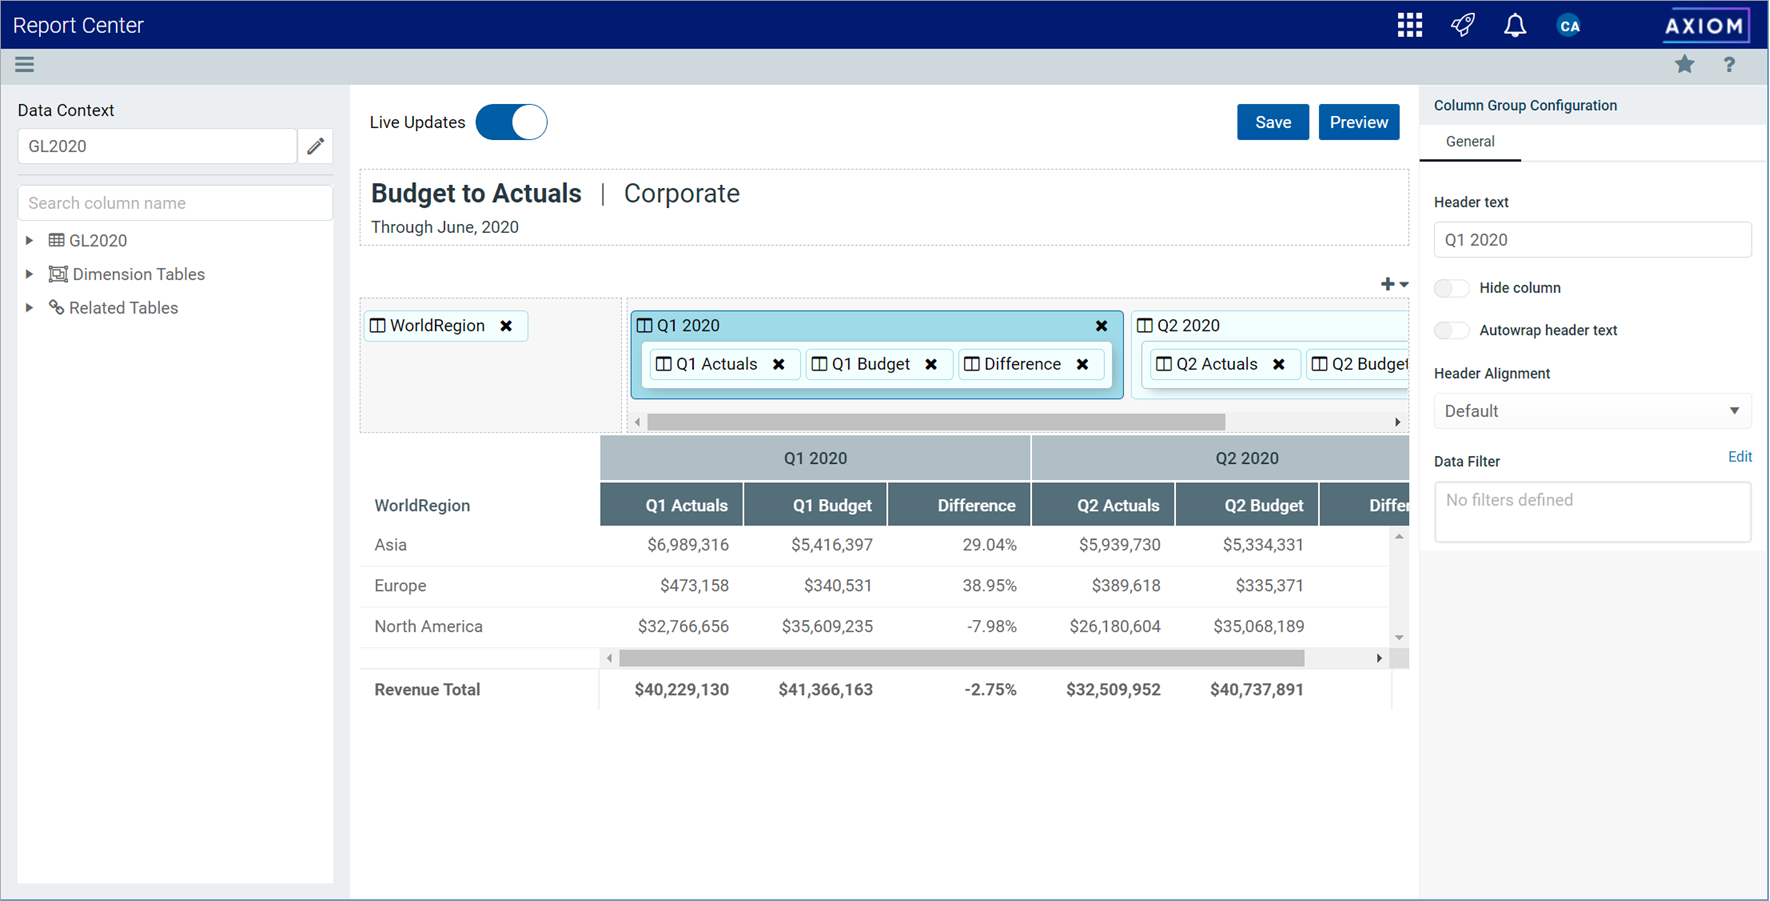
Use the plus icon at the top right of the Column Definitions box to add column groups to the grid as needed. Using column groups, you can display multiple columns grouped underneath a header. For more information, see Defining column groups for a web report.
In the following example, two column groups have been added for Q1 and Q2.
-
Click Save to save the report.
-
In the Save Report As dialog, complete the following fields and then click Save:
Item Description File name
The name of the report file. This is the name that users will see in the Report Center.
Description
Optional. A description of the report. Currently, descriptions do not display in the Report Center, but they can be viewed in the Axiom Financial Institutions Suite Desktop Client using Axiom Explorer.
Save to folder
The folder in the Axiom repository where you want to save the report.
-
Click the folder icon
 to the right of the field.
 -
In the Choose output folder dialog, select a folder in the Reports Library. You can only select folders where you have read/write access to the folder. If a folder name displays with a lock icon, this means you have read-only access to that folder and therefore cannot save a new report there.
-
Click OK to choose the folder and return to the save dialog.
The path to your selected folder now displays in the field.
If you use a file name that already exists in the target folder, you will be prompted to choose whether or not to overwrite the existing file. If you choose not to overwrite, you are returned to the Save Report As dialog so that you can use a different name and/or output folder.
-
Keep in mind that many of these steps can be done in any order. You can configure the grid settings before defining report titles, and so on. The main dependency is that you must select a primary table for the data context before you can begin adding columns to the report.
