AX1830
The row dimension for a web report defines the summation level for the row data. For example, you may want the rows in your grid to show data by department, region, entity, account, or some combination of dimensions. You specify a table column to use as the row dimension, and then the rows in the grid are dynamically generated based on the unique values in that column.
NOTE: If you want your report to use a static row structure with multiple sections instead of dynamically generating the rows, then use a fixed row structure instead of a row dimension.
The row dimension for the report is placed in the left-hand box at the top of the Report Canvas, known as the Row Dimensions box. The report grid cannot render until you specify either a row dimension or a fixed row structure.
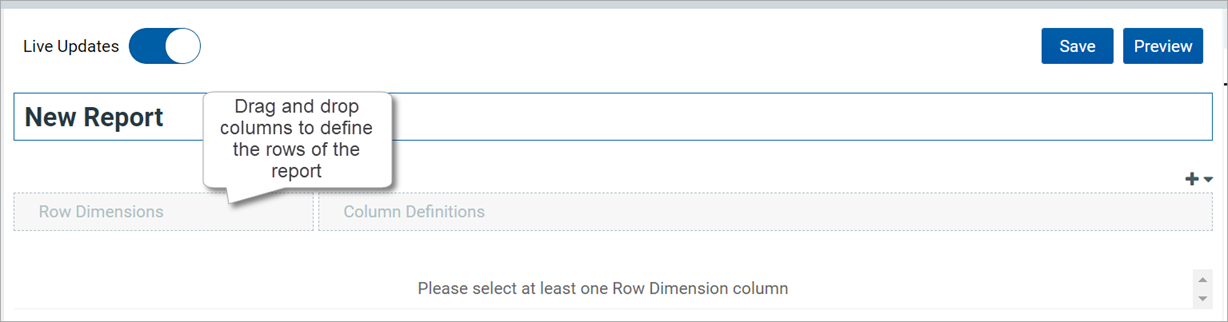
Row Dimensions box at the top of the Report Canvas
Web reports can have multiple row dimensions. If two or more row dimensions are specified, then each row in the report represents a unique combination of the dimensions. For example, if the row dimension is just Dept, then each row shows data for a department. If the row dimension is Dept and Acct, then each row shows data by the unique combinations of department and account.
To specify a row dimension for a web report:
-
In the Data Panel of the Report Builder, expand the table tree until you locate the column that you want to use as a row dimension.
If the Data Panel is empty, this means you must select a primary table first.
-
Drag and drop the column to the Row Dimensions box at the top of the Report Canvas.
The grid in the canvas updates to show items from the specified row dimension.
-
Select the column name in the Row Dimensions box, and then use the Column Configuration panel to configure display properties such as column width, alignment, header text, and formatting. For more information, see Configuring column properties for a web report.
-
If multiple columns are present in the Row Dimensions box, you can drag and drop them within the box so that they display in the desired order within the grid.
Once a row dimension is specified, the grid in the Report Canvas updates to show values from that column. Additionally, the Data Panel updates to remove any tables that are incompatible with the specified row dimension. You can now build out the data columns of the report by dragging and dropping columns from the Data Panel, and by creating calculated columns. For more information, see Adding data columns and calculated columns to a web report.
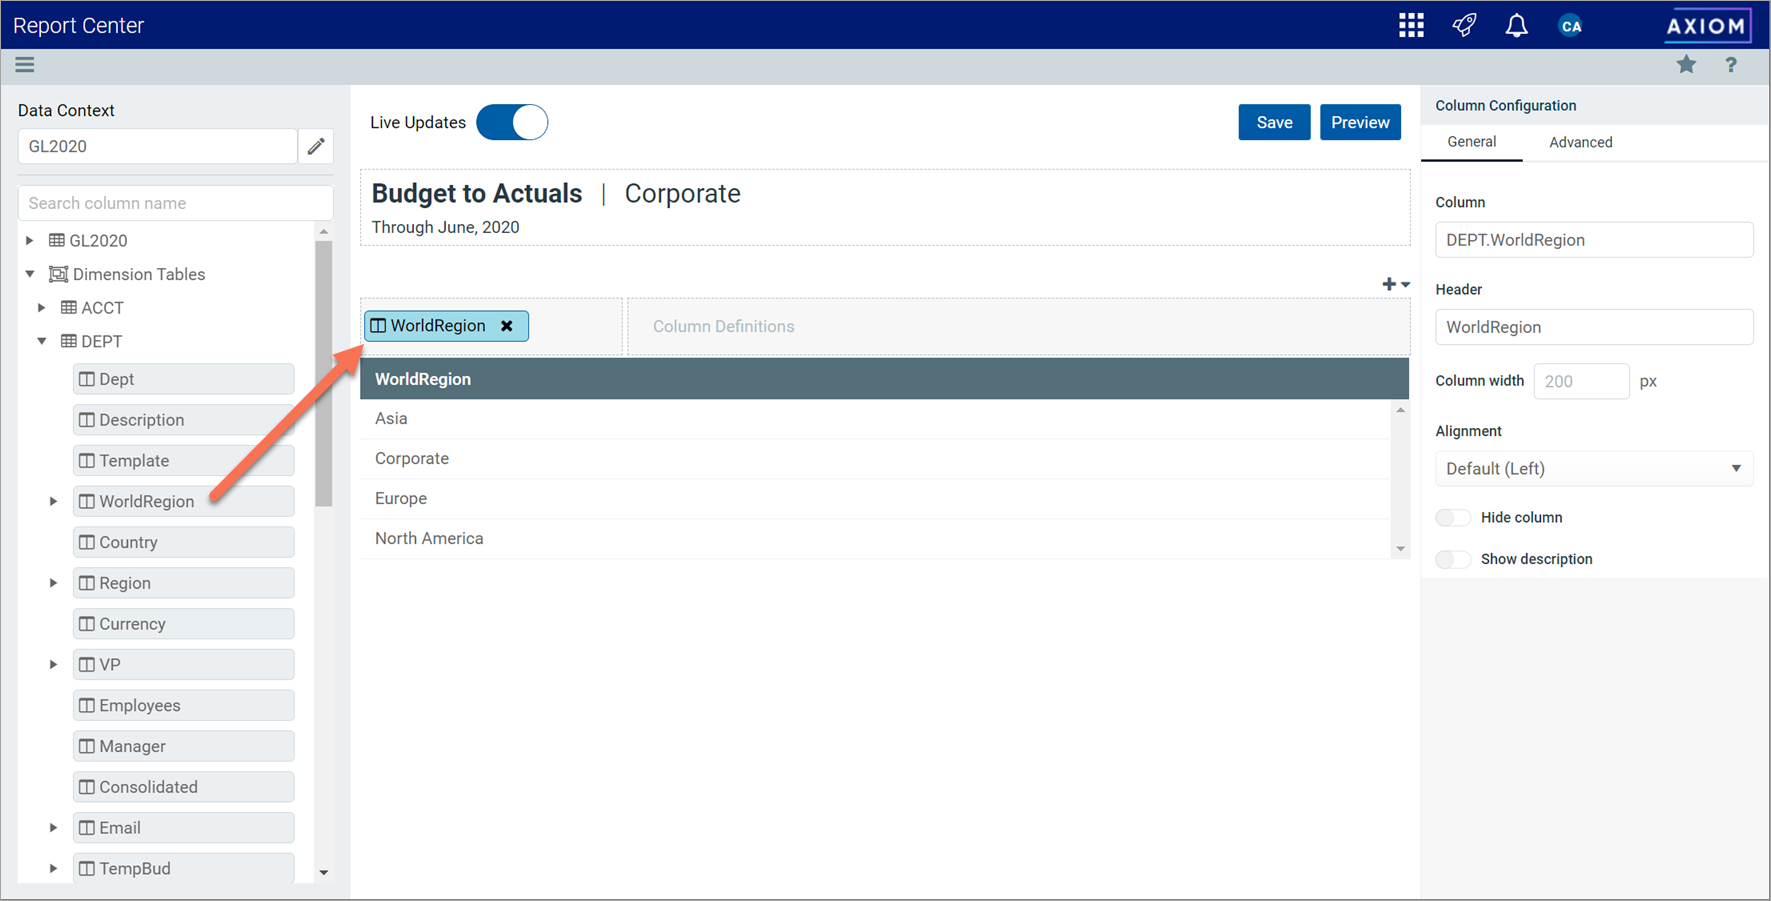
Defining a row dimension for a web report
Displaying descriptions for the row dimension
In many cases your row dimension will be a code, such as a department code or an account code, and you want to display the description for the code next to it.
To display descriptions on a dimension column:
- Select the row dimension column in the Row Dimensions box.
- In the Column Configuration settings, on the General tab, enable Show description.
- From the Description display format list, select the desired display format.
In the following example, the Dept column has been configured to show descriptions using the Value - Description format. If you select a format that shows descriptions first, such as Description (Value), then the rows will be sorted by the descriptions instead of the underlying values.
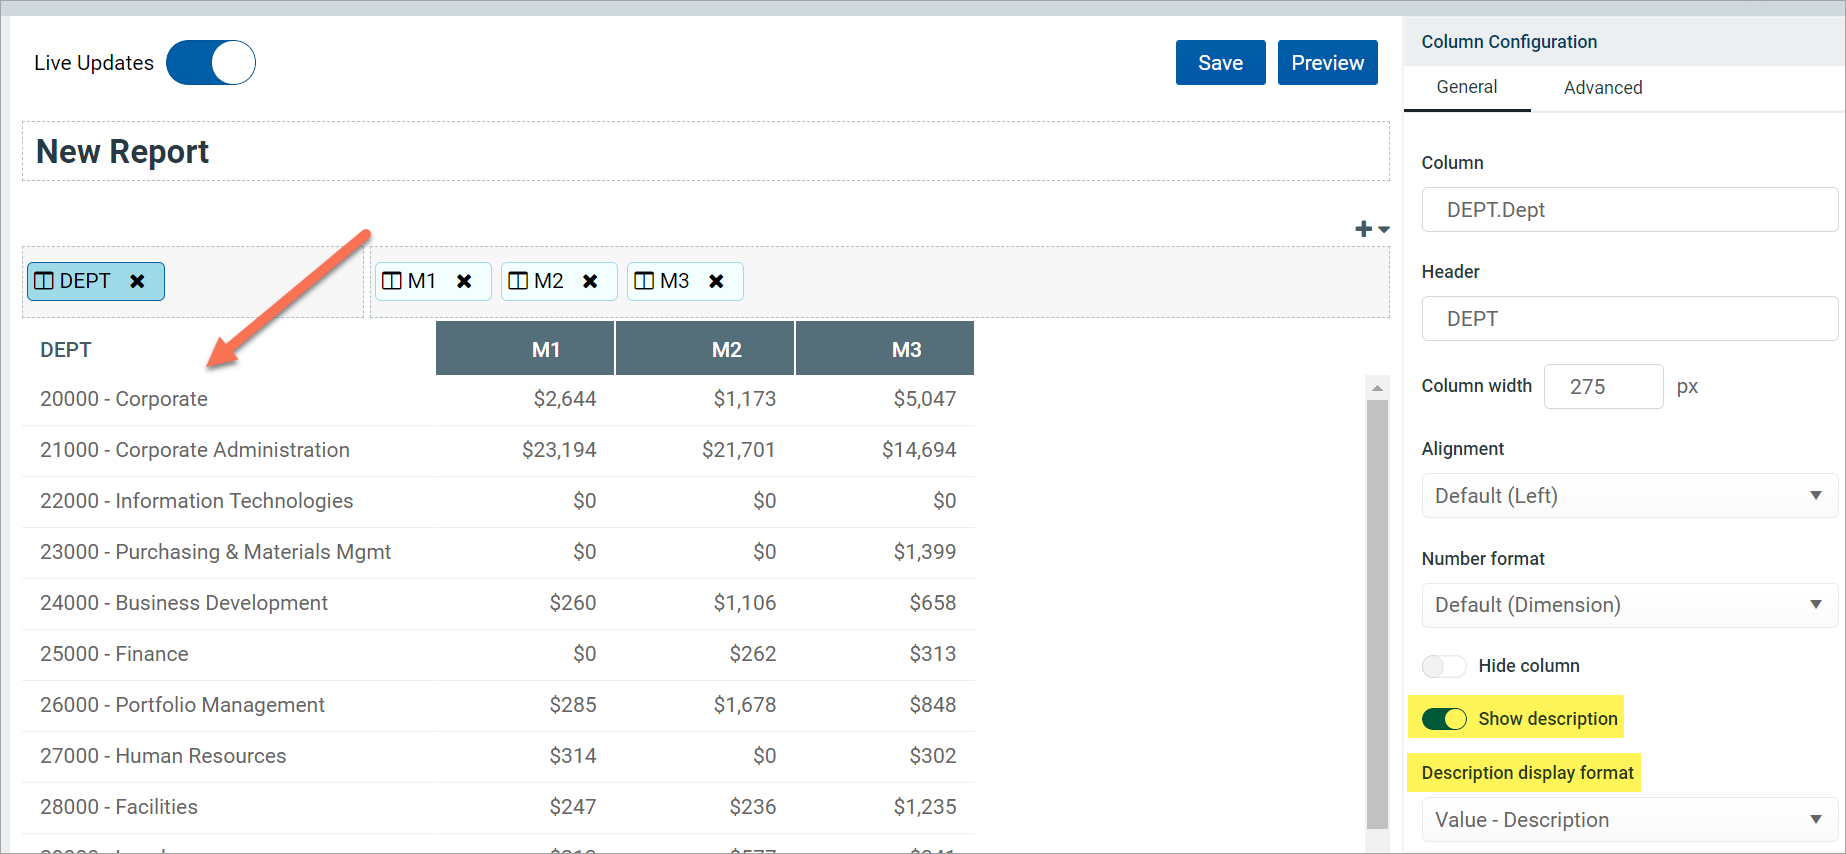
Example row dimension column configured to show descriptions
Although you can add the description column to the grid as a separate column instead of using the Show description option, this may not always achieve the desired results. For example:
-
If you add the description column as a row dimension, then it will display next to the dimension values but it will cause the data to be additionally grouped by the description values. This is not recommended because the additional grouping is unnecessary, and in some cases may not produce the desired results (for example, if descriptions are not unique).
-
If you add the description column as a regular column, then the descriptions will not be frozen next to the dimension codes for scrolling purposes.
Filtering the row dimension
In some cases you want the report to display a subset of values from the row dimension column, instead of all values. To filter the row dimension values, use the Grid Configuration properties to define a Data Filter for the grid.
For example, if the row dimension is Dept but you want the report to only display departments that belong to a specific entity, define a grid-level data filter such as Dept.Entity='Entity 1'. This will filter the grid so that it only shows data that belongs to Entity 1, including the row dimension values. Department codes that do not belong to Entity 1 will not be included in the data query.
Changing the row dimension
You can change the row dimension at any time by dragging and dropping additional columns to the Row Dimensions box, or by removing existing row dimensions.
To remove a row dimension, click the X icon to the right side of the column name. If you remove the only row dimension, the grid in the Report Canvas cannot be rendered until you specify a new one.
If you change the row dimension after adding data columns and calculated columns, or if you change the primary table after specifying a row dimension, it is possible that some of the selections may be incompatible with each other. In this case, an error will display when the Report Builder attempts to refresh the data in the Report Canvas. You may have to remove incompatible columns, change the row dimension, or change the primary table in order to restore a valid grid configuration.
If you decide that you want to change the report to use a fixed row structure instead of a row dimension, use the Grid Configuration properties to enable fixed rows and then choose a fixed row structure. For more information, see Specifying the fixed row structure for a web report. Any columns currently placed in the Row Dimensions box will be ignored while fixed rows are enabled for the report.
