AX1676
Using the Report Designer, you can configure all aspects of a web report, including:
- Defining general report settings like the display title, PDF settings, and optional associated file group
- Defining one or more data sources to determine the data available to the report
- Configuring component properties to determine the data and/or text shown in each component, and other display properties
- Defining refresh variables to allow users to change the data in the report based on their selected values
The Report Designer is available as follows:
-
When you create a new web report, the new report is automatically opened in the Report Designer.
-
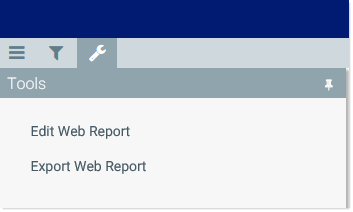
You can edit existing reports in the Report Designer. Open the web report that you want to edit, then select Tools > Edit Web Report to open the report in the Report Designer.
Report Designer overview
The Report Designer consists of the following:
- Configuration panels docked along the left-hand side of the screen, to configure various aspects of the report.
- A report canvas area showing the placement of the components in the report.
- A secondary toolbar in the right-hand side of the task bar to save and preview the report.
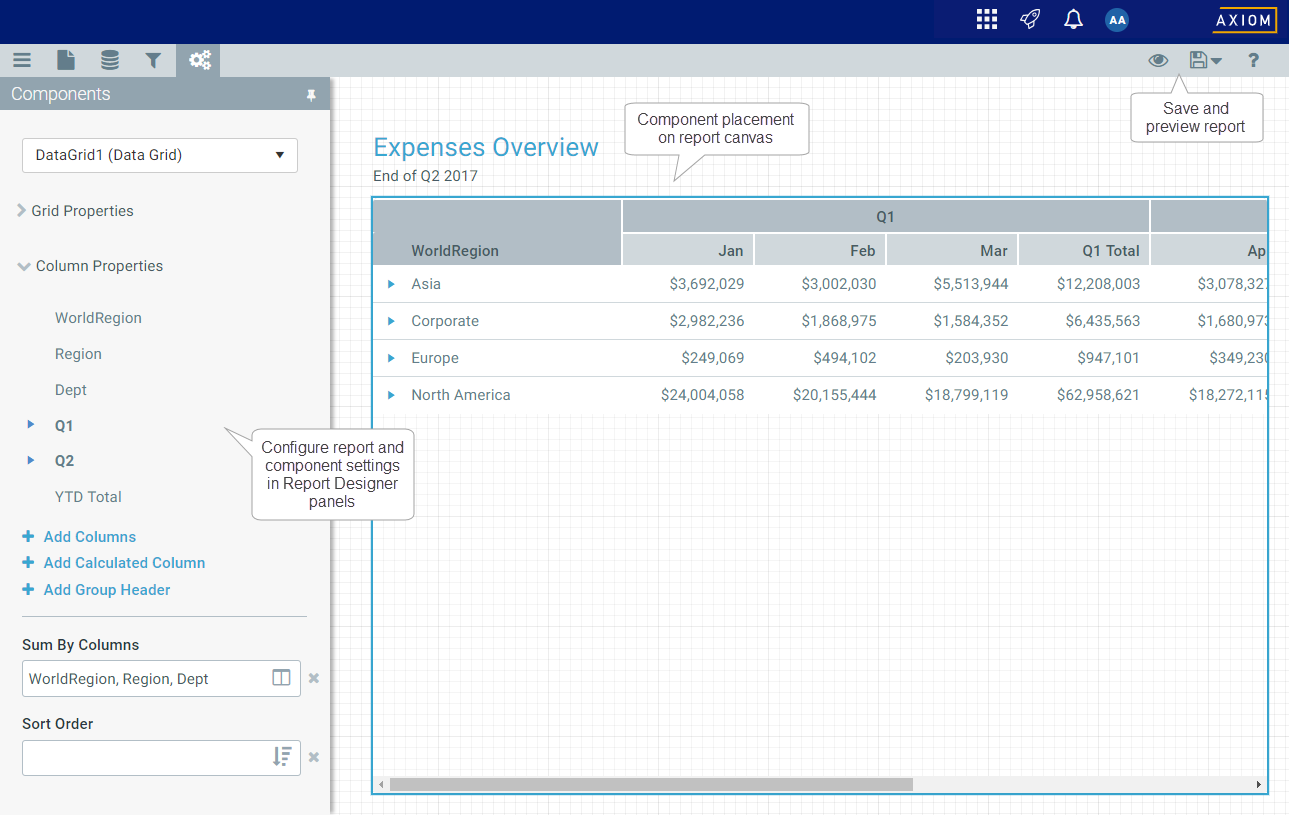
Example Report Designer
The Report Designer configuration is organized into the following panels. Select the icons in the left-hand side of the task bar to switch between different panels.
| Report Designer Panels | Icon | Description |
|---|---|---|
|
|
Optional. Define general settings for the report, such as a title and an associated file group. |
|
|
|
Define one or more data sources for the report. Data sources determine the data available to Data Grid components. |
|
|
|
Optional. Define one or more refresh variables for the web report, to allow users to filter the report data on demand. |
|
|
|
Configure the components in the report, such as a Label component for the report title, and a Data Grid component to display data. Component properties determine the display and content of each component. |
Previewing and saving the web report
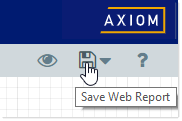
At any time, you can save the current web report configuration by clicking the Save icon in the right-hand side of the task bar.
If you want to save a copy of the web report, click the down arrow next to the Save icon to open the Save menu, then click Save As.
Although the display of the web report in the Report Designer is close to the actual display, components are not fully interactive within the editor. If you want to see how end users can interact with the web report, you can use the preview feature.
-
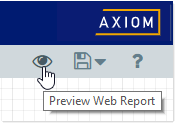
To preview the web report, click Preview (the eye icon) in the right-hand side of the task bar. This automatically saves the report and opens it in the normal web report view. You can then test interactivity as needed.
-
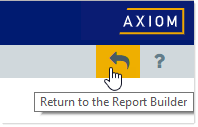
To return to the Report Designer and make further changes, click Return (the back arrow icon) in the right-hand side of the task bar.