Details
The Details section is the most dynamic and versatile section in scorecards. There are two ways to access a Details section:
- Add the section to any Scorecard; see Customize scorecards for more information.
- Drill from another section:
- Two Column section: Click a speedometer needle or line chart data point.
- Charges and Costs Detail: Click a hyperlinked table value.
Add the section
You can add a Details section to any scorecard by clicking +Add Section and selecting Details from the Data Insights category. In Customizer Mode, you can move, delete, or rename the section. For more information, see Customize scorecards.

You also have the option to specify a default Details template, so the section populates with the selected Details template when you open your scorecard. See Section-specific templates for more information.
Work with data
The Details section offers you several customization parameters for your analysis. To change your selection, click the pencil icon. 
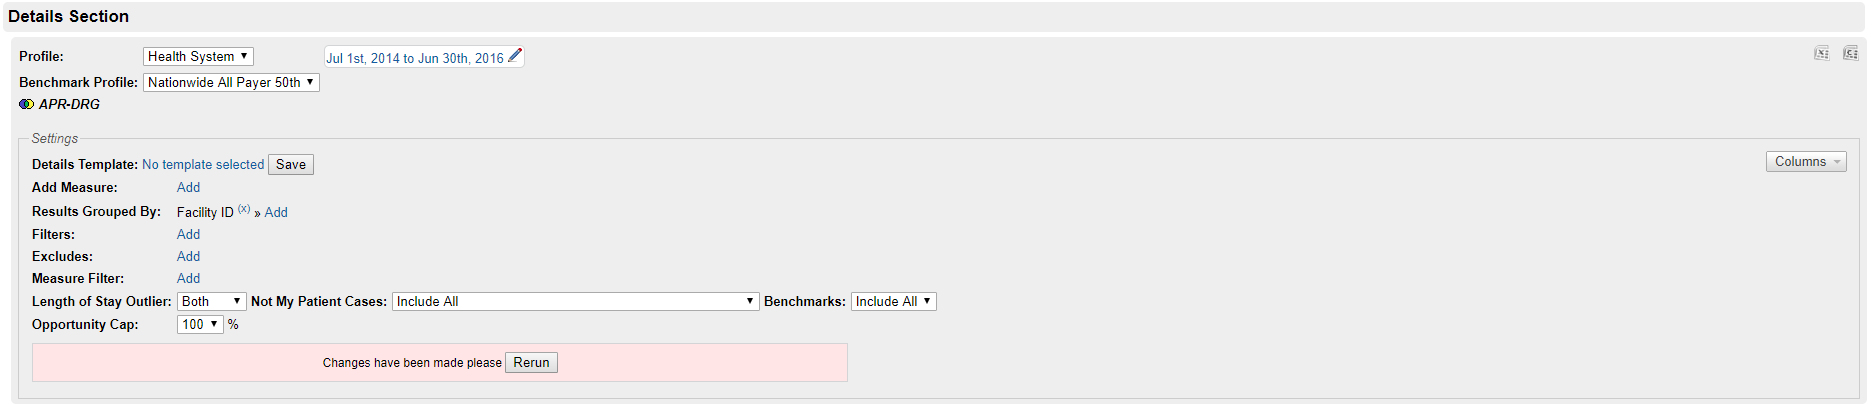
- Details is a profiles-based section, so you can start your analysis by selecting one of your Internal Profile types from the Profile dropdown and selecting your time period of interest.
- The Grouping Type icon appears below your profile selections as a visual reminder of the Grouping Type you selected in the Profile Customizer for your Profile of interest.
 or
or  or
or 
- Details allows you to select from any of your Profiles in the Benchmark Profile field, so you can compare your internal data internally or externally.
- The parameter settings of your Details section can be saved as a Details template. See Section-specific templates for more information.
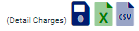
- As with most scorecard sections, you can export your data table as an Excel spreadsheet or CSV file by clicking the icons in the top right corner. See Export data for more information. Note that the Detail Charges export is only available when you are viewing patient-level data (group by Axiom Encounter ID)
- As with other dynamic data tables in scorecards, you can move, sort by, and filter the columns in the Details table. See Table functionality for more information.
- Click the Columns button in the top right corner to easily add or remove available columns based on the Measures and Group bys you have already selected.

When you change any of the section parameter settings, a red box appears below the menu. Click the Rerun button to run the data search again, recalculating the results according to the options you chose.
| Parameter | Function |
|---|---|
| Add Measure | Click Add to select which measure(s) you would like to view. See Measure definitions for more information about available measures. |
| Measure Layout |
After you have added at least one measure to your Details table, you have the option to align your measures vertically or horizontally. Click the hyperlinked selection (Horizontal or Vertical, based on the current orientation) to modify.
|
| Results Grouped By | Click Add to select which stratification(s) you would like. This action adds a column for the group-by and a row for each level of aggregation. |
| Filters | This option allows you to filter data according to features of your encounters. Note that filters can only be applied to fields you have already added to your Details table as a Group-by. The fields are:
|
| Excludes | This is the complimentary feature to Filters. This option allows you to filter out data according to features of your encounters. Note that excludes can only be applied to fields you have already added to your Details table as a Group-by. |
| Measure Filter |
This feature allows you to filter encounters based on the encounter-level measure values. Measure filters can only be applied to measures you have already added to your Details table. See Apply a Measure Filter for more information. |
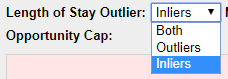
| Length of Stay Outlier |
Click the dropdown arrow to select if you would like to see encounters labeled as LOS Outliers, LOS Inliers (not outliers), or both (all encounters). See LOS Outlier & Excess Days calculations for details about the LOS Outlier designation.
|
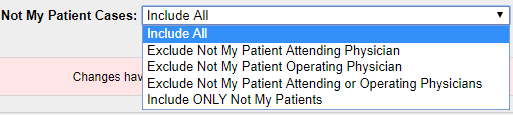
| Not My Patient Cases |
In the Clinical Case Summary for each encounter, you have the option to designate the encounter as "Not My Patient" for a given physician. This dropdown selection in Details allows you to account for those designations in your analytics.
|
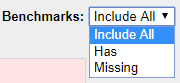
| Benchmarks |
Click the dropdown arrow to select if you would like to view only encounters with benchmarks (Has), only encounters without benchmarks (Missing), or all encounters (Include All). Keep in mind that this an encounter-level filter.
|
| Opportunity Cap |
Clinical Analytics calculates the Opportunity as 100% of the difference between the benchmark and facility values. Sometimes this isn't realistic, so the Opportunity Cap allows you to specify the percentage of actionable opportunity you deem reasonable. For example, if the Cost Opportunity is $1000, but you have an Opportunity Cap of 80%, Clinical Analytics will display the Cost Opportunity as $800.
|
Applying a Measure Filter
Measure filters filter out encounters that do not meet your measure filter criteria. Remember that this in an encounter-level filter, not an aggregate-level filter, so select your measure filter(s) carefully to achieve your desired analytics.
- To add a measure filter, click Add next to Measure Filter.
- A Measure dropdown appears to define your filter. Select the measure you would like to filter. You can only filter measures you have already added to your Details table.
- Select which column of the measure you would like to filter, select the logic for the filter (Equal To, Greater Than, Less Than, Greater Than or Equal to, Less Than or Equal To, or Not Equal To), and enter the applicable value for the logic. Click OK.
- Click Rerun to apply the new measure filter.


NOTE: This filter applies to the encounter level (individual patients) only, not to the aggregate measure values in the table.
