AX1379
Using the Row Editor, you can define fixed row structures for use in web reports. Fixed row structures define the following:
- The sections to be displayed in the report, including section titles and subtotal rows
- The data rows to be displayed within each section
When you use the Report Center to create a new fixed row structure or to edit an existing fixed row structure, it opens in the fixed row structure editor.
Overview
By default, the Row Editor consists of two primary areas:
- The section editor on the left-hand side, where you can add, reorder, and remove sections and data rows
- The property editor on the right-hand side, where you can define properties for the overall row structure, the selected section, or the selected row
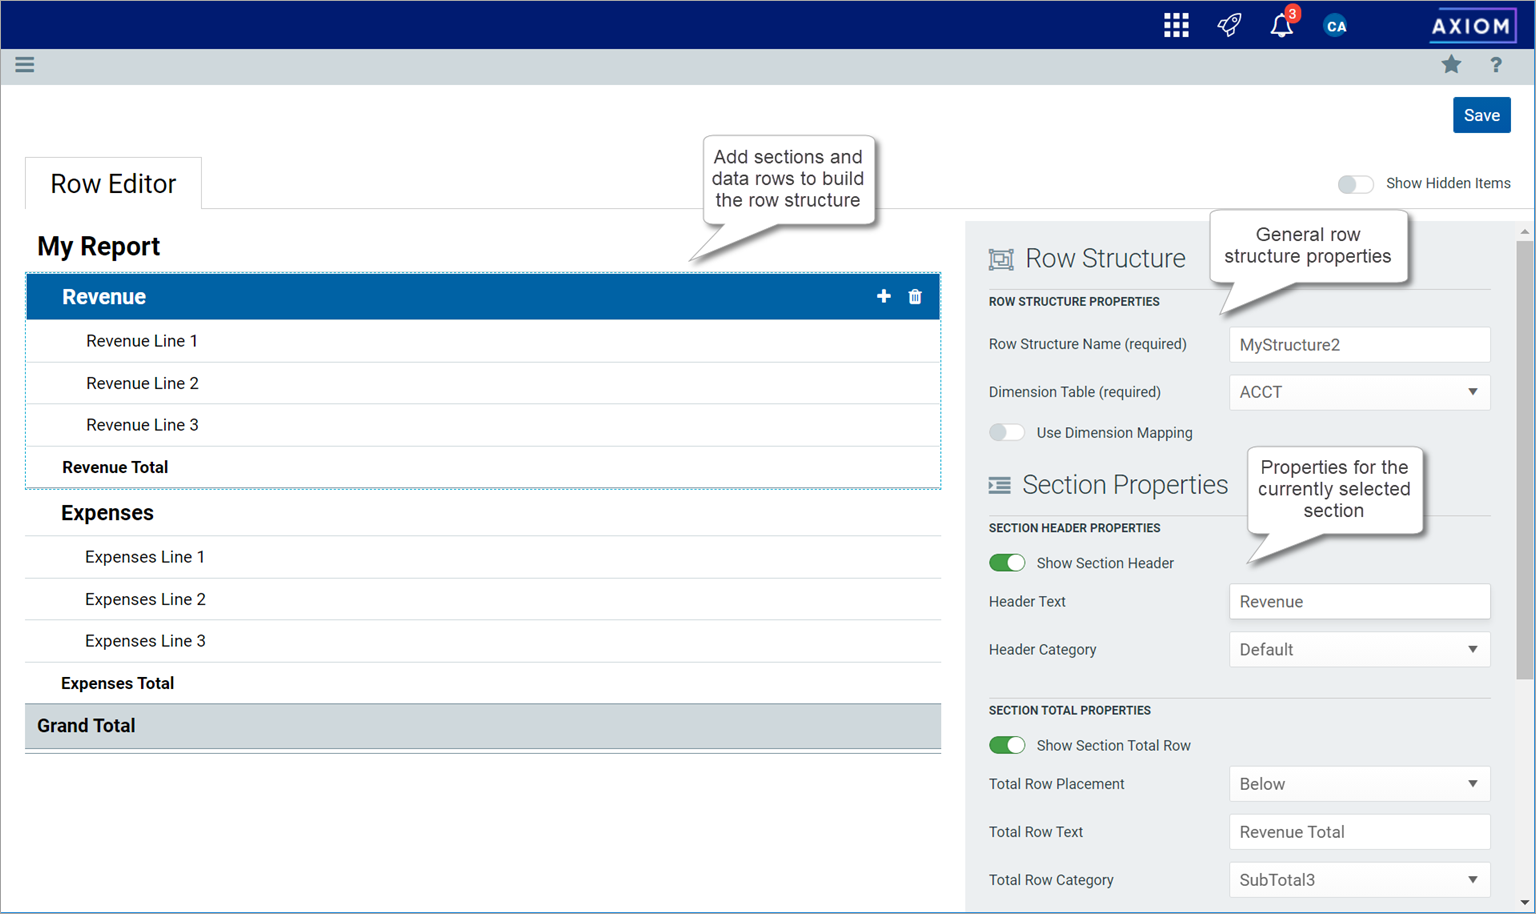
Row structure editor with a selected section
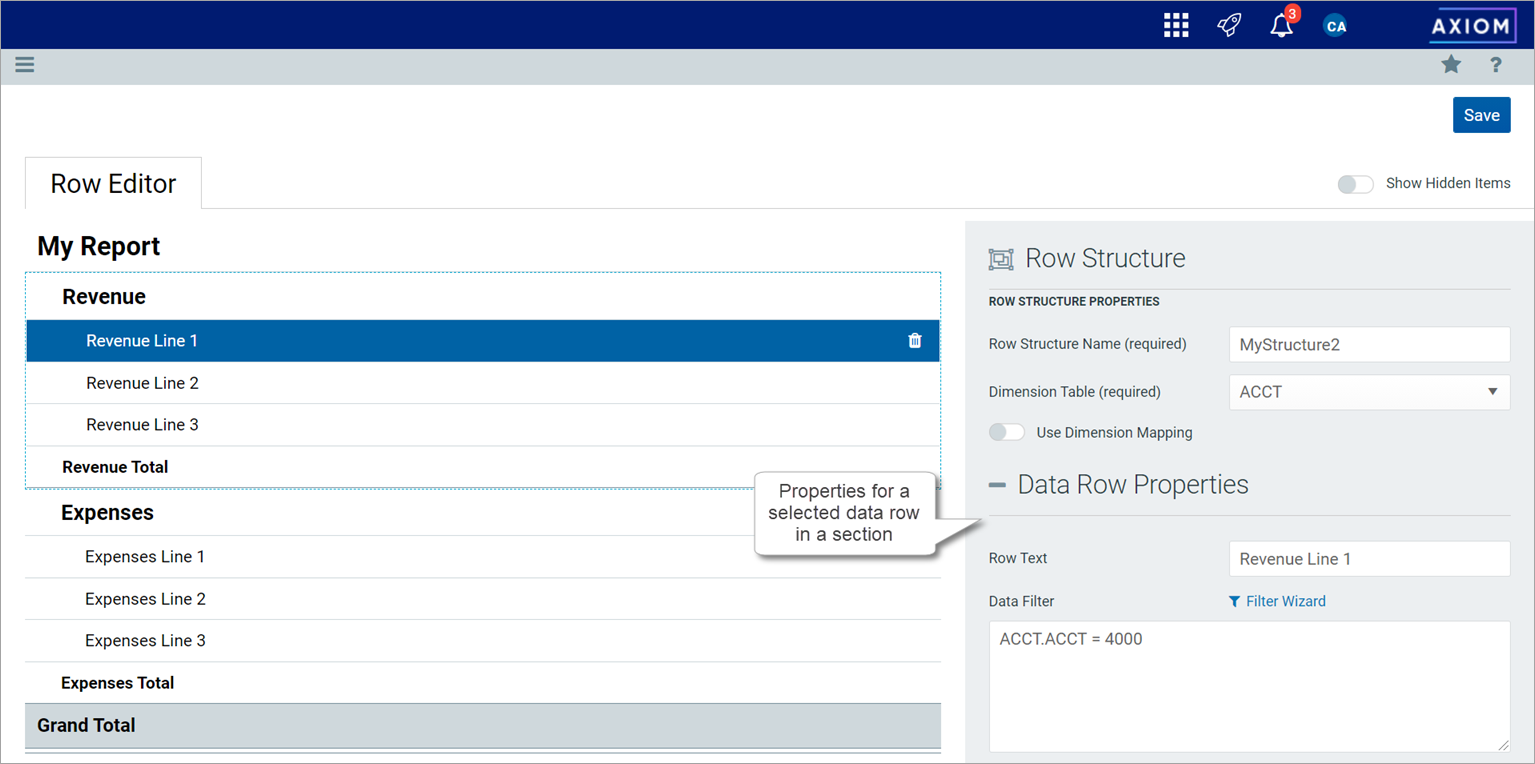
Row structure editor with a selected data row
If the row structure is configured to Use Dimension Mapping to define the row data, then another area is available via the Dimension Mapping tab. You can use the Dimension Mapping area to map dimension items to individual data rows. For more information on using dimension mapping, see Using the Dimension Mapping editor.
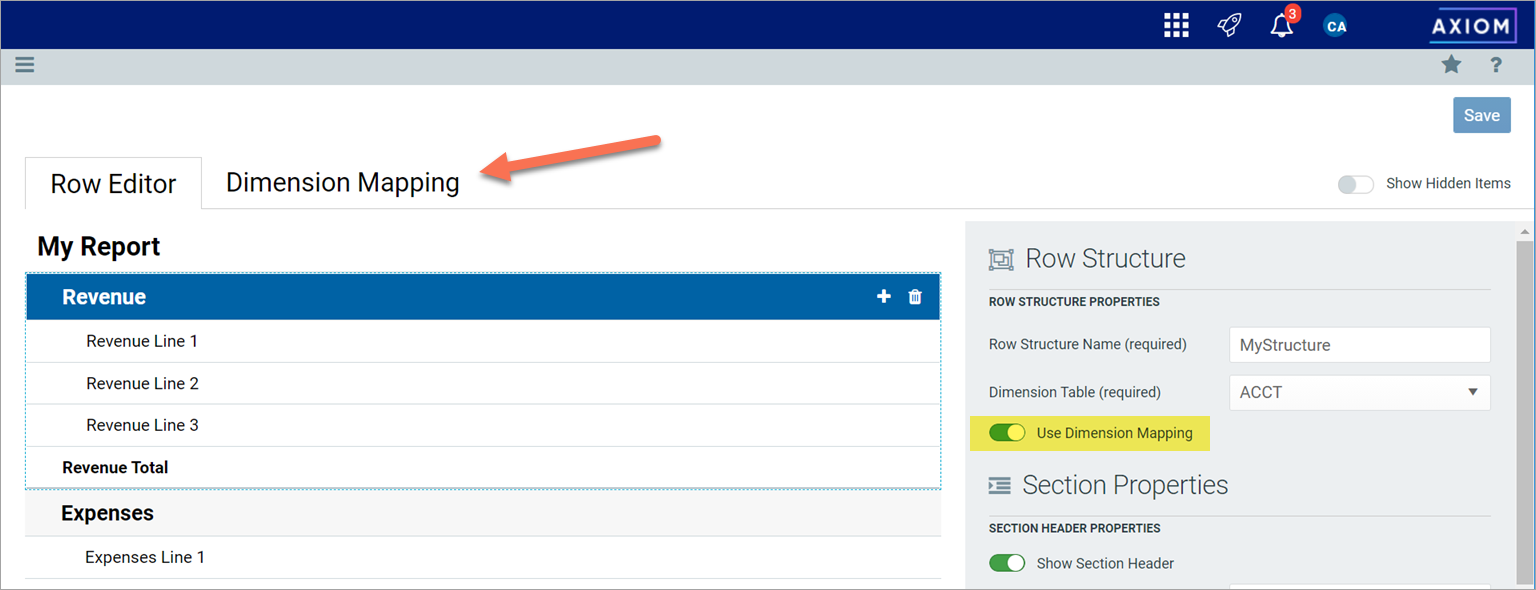
Row structure editor with Dimension Mapping tab
To save the row structure after making changes, use the Save button located at the top right of the editor.
Certain parts of the row structure can be configured as hidden, such as section header rows or total rows. By default, these hidden items no longer display in the editor. If you need to view these items so that you can work with them and configure them, you can toggle the option Show Hidden items at the top right of the editor.
Using dimension mapping versus row filters in a fixed row structure
When you build a fixed row structure, there are two different ways to define the data to be shown each in row:
-
Filters: Each row can have a filter criteria statement that defines the data for that row. For example,
Acct.Acct=4100orAcct.Category='Revenue'. -
Dimension mapping: Each row can be assigned one or more items in a specified dimension. For example, if Acct is the specified row dimension, then you can view the list of accounts and map them to specific rows in the report as needed.
The filter option is the most flexible way to build a fixed row structure, because:
- You can use any valid filter criteria statement to define the data in each row, including compound statements using AND or OR, and referencing any table (not just the specified dimension table).
- You can define filters at the section level, which then combine with all row-level filters in the section.
- You can repeat dimension elements within the row structure—for example, to create multiple sections that show revenue for different regions or lines of business.
However, because the filter option is more flexible, it also requires a more advanced level of knowledge about your data structures. You must take care not to create invalid or conflicting filters, and make sure that your filters result in the data that you want to display in the report.
In contrast, the dimension mapping option is the easiest to set up, because:
- You are presented with a full list of all items in the specified dimension, which you can search and filter as needed.
- To assign an item to a row in the report, you simply select the item and then click the arrow button to move it over to the row. Each row can be assigned as many items in the dimension as needed.
- It is very easy to see exactly which dimension items will display on each row, and to see which items have not yet been assigned to rows.
However, the dimension mapping option is less flexible. Rows can only display data from the specified row dimension, and each item in the dimension can only be assigned to a single row.
The following required properties at the top of the right-hand pane apply to the entire row structure.
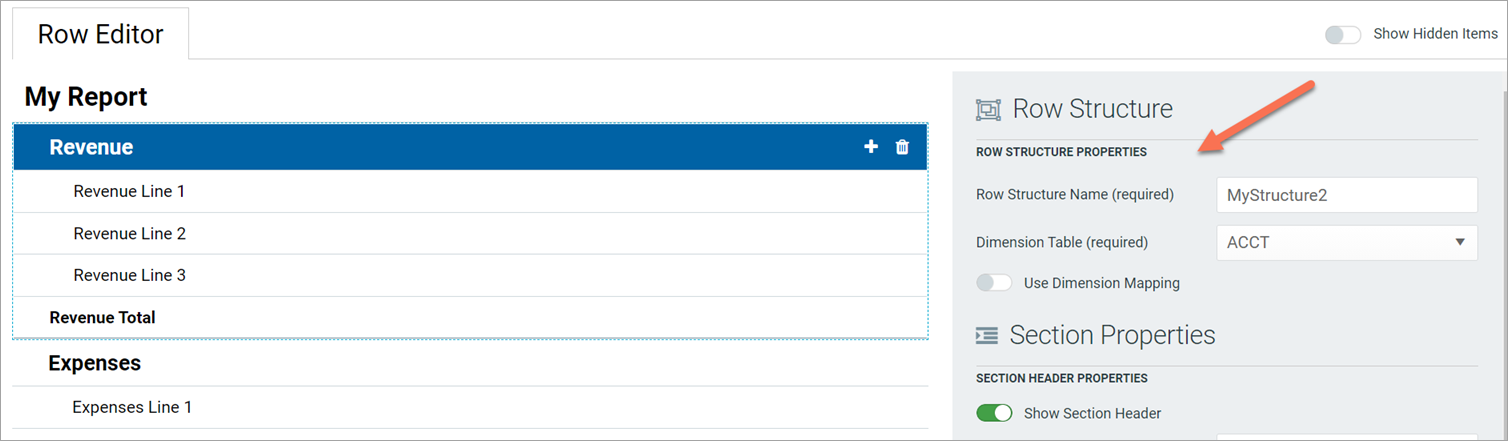
Example Row Structure properties area
| Item | Description |
|---|---|
|
Row Structure Name |
The name of the row structure. The name identifies the row structure so that it can be selected when creating or editing a web report. |
|
Dimension Table |
The primary dimension table to be used on the data rows. You can select any reference table in your system. This selection is used as follows:
|
|
Use Dimension Mapping |
Specifies whether the data in data rows is defined by using filters or by using dimension mapping. By default, this is disabled, so data is defined using filters. If instead you want to use dimension mapping for the rows, click the toggle switch to enable this option. The toggle switch shows as green when enabled and as gray when disabled. If Use Dimension Mapping is enabled, the row structure editor updates as follows:
For more information on the differences between using filters or dimension mapping to define data rows, see Using dimension mapping versus row filters in a fixed row structure. |
Adding, removing, and reordering sections
Using the Row Editor tab, you can build your row structure by adding, removing, or reordering sections. Each row structure starts with a top-level root section that includes an optional header and an optional grand total.
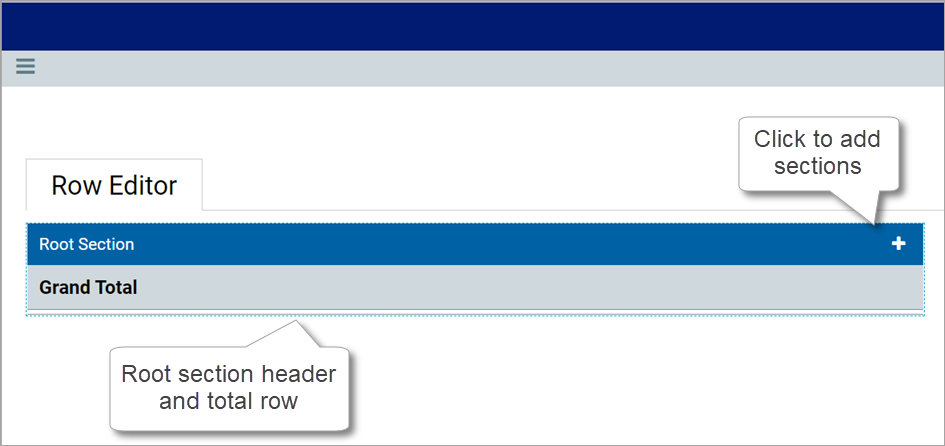
Row editor with starting root section
To add new sections to the row structure, select the section header row—the Root Section row—and then click the plus sign and select Add New Section.
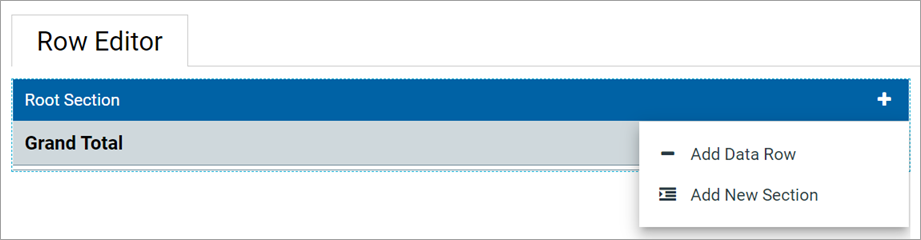
Option to add a new section
The new section is added within the root section. You can continue to add as many sections as needed at this level.
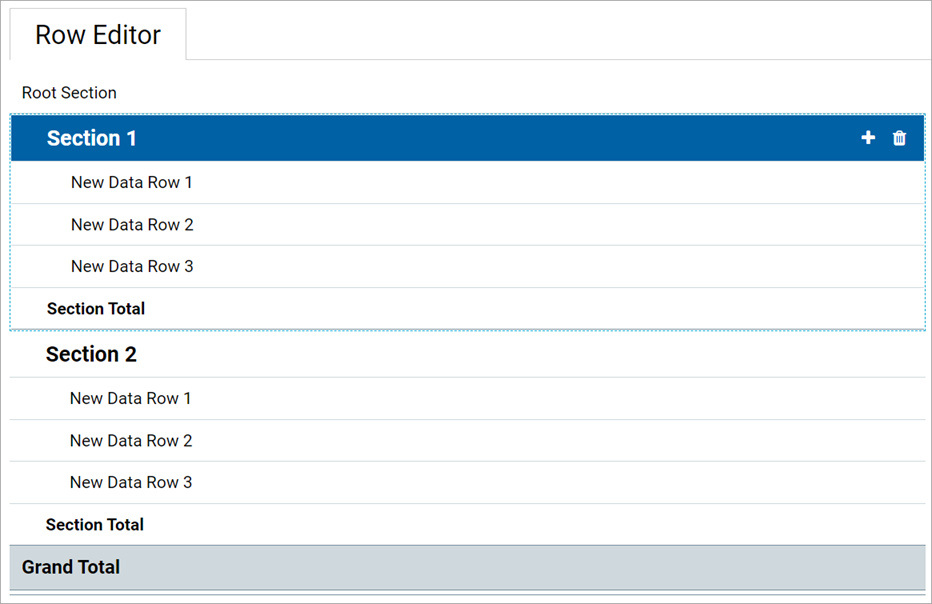
Row editor with two newly added sections
To add subsections within a section, select the section header row for any section, and then click the plus sign and select Add New Section. The new subsection is added to the current section. You can nest as many section levels as you need by adding subsections to sections.
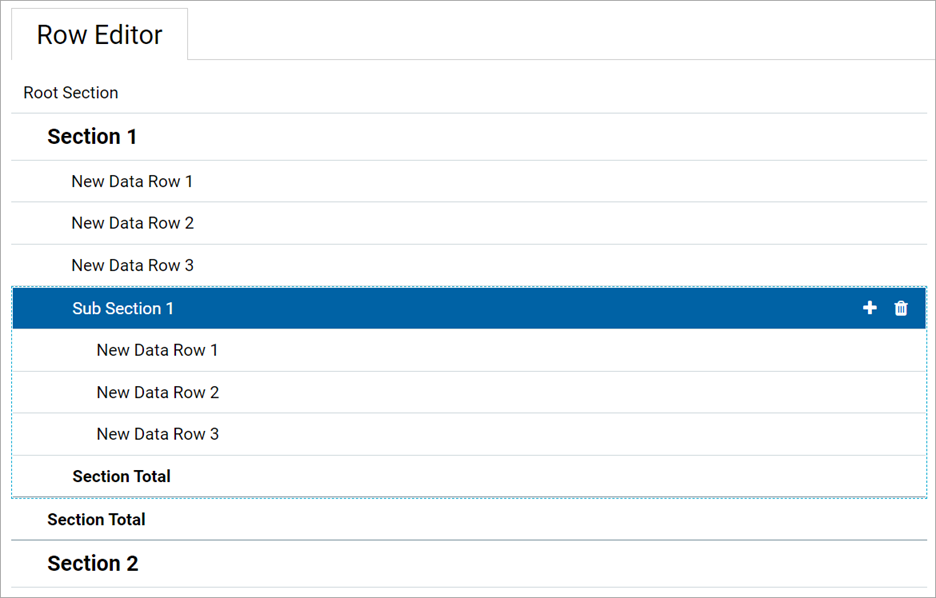
Row editor with newly added subsection
Newly added sections use default text and styling, which can be configured for each section. Each newly added section consists of the following by default:
-
A header row to display optional header text for the section. If you do not want a header row to display for a particular section (including the root section), you can hide it by disabling Show Section Header when configuring the section properties.
-
Three data rows to display queried data in the section. You can add or remove data rows as needed.
-
A total row to display the totaled data for the section. If you do not want a total row for this section (including the root section), you can hide it by disabling Show Section Total Row when configuring the section properties.
Once you have added sections, you can make further section changes as follows:
-
To reorder sections: Select the header row of a section and then drag and drop it to a new location within the same level of the structure. For example, if you have three sections at the same level, you can drag and drop these three sections to change their order. But you cannot drag and drop one of these three sections to a lower level or a higher level.
-
To delete a section: Select the header row of the section and then click the delete icon (trash can). The section and all of its subsections are deleted. Note that the root section is required and cannot be deleted.
IMPORTANT: Make sure you no longer need the section before clicking the delete icon. The section will be deleted immediately with no confirmation prompt. If you deleted a section by accident, then you can exit the row structure editor without saving, but you will also lose any other unsaved changes that you have made during the current session.
To configure the properties for a section, select the section header and then complete the Section Properties in the right-hand pane.
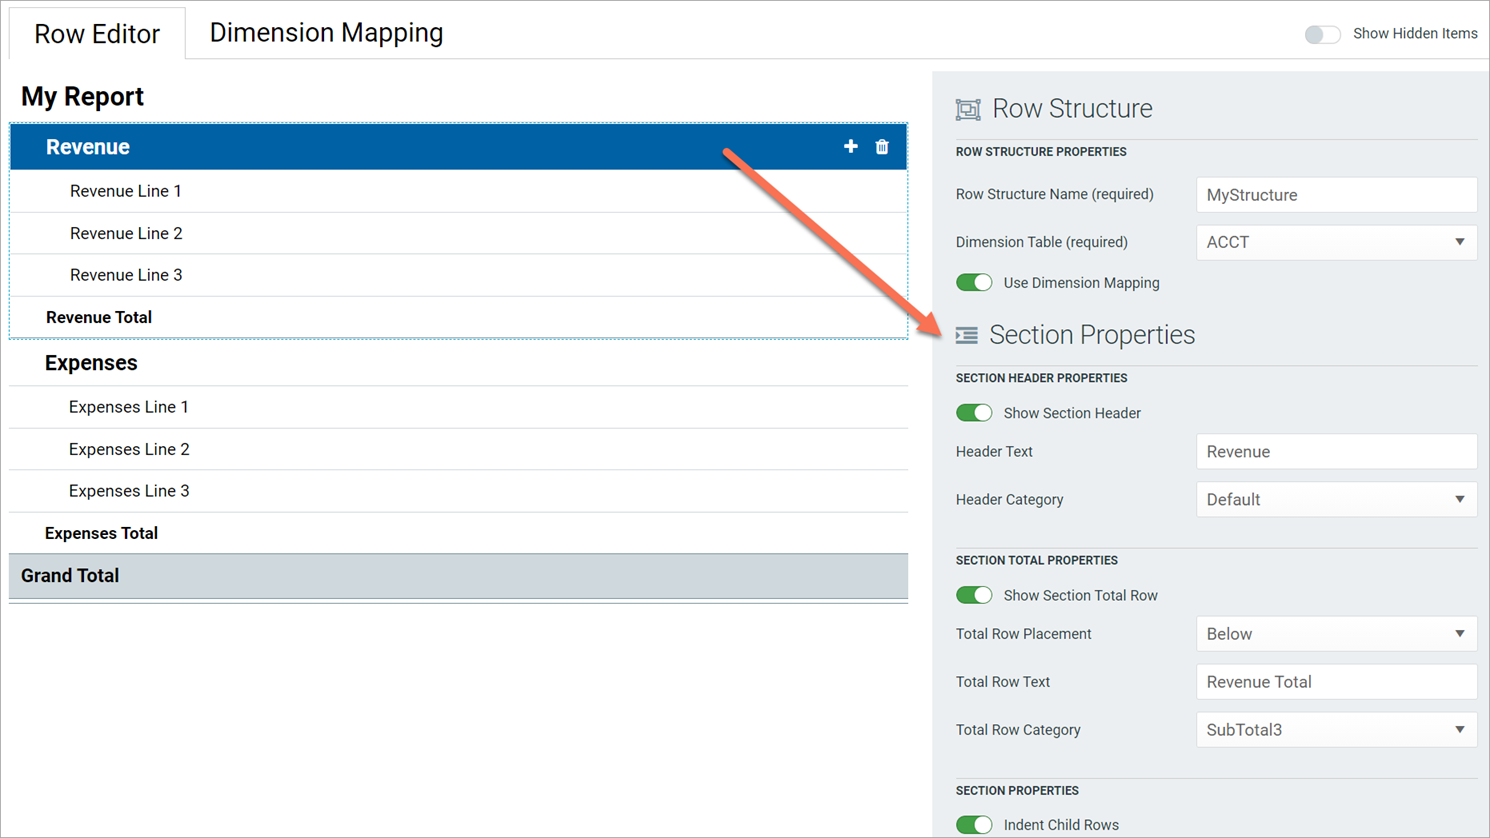
Example Section Properties area
Section Header Properties
| Item | Description |
|---|---|
|
Show Section Header |
Specifies whether the section header row is visible when the row structure is used in a report. By default, this option is enabled, so the section header row is visible. If you do not want this section to have a header row, disable this option. The toggle switch shows as green when enabled and as gray when disabled. If this option is disabled, then the remaining section header properties become hidden because they do not apply. Note that you may want to define header text before disabling the option, to make it easier to identify the section when working within the row structure editor. NOTE: If you hide the section header, then you will no longer be able to select the header row in the editor for purposes of adding rows or subsections, configuring the section, reordering the section, or removing the section. If you need to work with the section header row, you can enable the option Show Hidden Items, located at the top right of the editor. This will cause all hidden items to show in the row structure, so that they can be selected and configured. |
|
Header Text |
The text to display on the section header row. By default, this is set to "Root Section" for the root section header and "Section" for all other newly added sections. The header text should be edited to reflect the data shown in this section. |
|
Header Category |
The style to use on the section header row. The style determines display attributes such as font size and font weight. Select one of the following:
By default, the header category is set to Header1 for the root section header, and Default for all newly added sections. |
Section Total Properties
| Item | Description |
|---|---|
|
Show Section Total Row |
Specifies whether the section total row is visible when the row structure is used in a report. By default, this option is enabled, so the section total row is visible. If you do not want this section to have a total row, disable this option. The toggle switch shows as green when enabled and as gray when disabled. If this option is disabled, then the remaining section total properties become hidden because they do not apply. |
|
Total Row Placement |
The location of the total row in the section, either Below the data rows or Above the data rows. The total row is located below the data rows by default. |
|
Total Row Text |
The text to display on the section total row. By default, this is set to "Grand Total" for the root section total and "Section Total" for all other newly added sections. |
|
Total Row Category |
The style to use on the section total row. The style determines display attributes such as font size, font weight, shading, and borders. Select one of the following:
By default, the total row category is set to Grand Total for the root section total row, and Subtotal3 for all newly added sections. |
Section Properties
| Item | Description |
|---|---|
|
Indent Child Rows |
Specifies whether the rows in this section are aligned with the section header row or indented. By default, this is enabled, so the rows are indented. If instead you want the rows to be aligned with the section header row, disable this option. The toggle switch shows as green when enabled and as gray when disabled. |
|
Parent Total Row Behavior |
Specifies how the data in this section is treated when computing the total row of the parent section. Select one of the following:
Although this option displays on the root section, it does not apply because the root section does not have a parent section. For example, imagine that you have a parent section with two subsections. Subsection A totals 5000, and Subsection B totals 1000.
|
|
Section Data Filter |
Optional. A data filter to apply to all of the data rows in this section, including any subsections. This is intended to be used when all rows in the section need to be filtered by a particular dimension or grouping, so that you do not need to repeat that dimension grouping on each individual data row. Only applies when Use Dimension Mapping is disabled. Enter the filter criteria statement to apply to the data rows in this section. Section data filters use normal filter syntax for Axiom Financial Institutions Suite. Although you can use the Filter Wizard to create the filter criteria statement, it is limited to creating filters based on the specified dimension table for the row structure. In many cases the section data filter needs to use a different dimension, so you must manually create the filter criteria statement. For example, imagine that you want to show revenue accounts in the rows of your report, but you want to split the data into two sections reflecting two different sales regions. You can create two sections and define section filters for each, such as |
Adding, removing, and reordering data rows
Using the Row Editor area, you can add data rows to a section, remove unneeded rows, and reorder rows. Each data row represents a record of data that you want to query from the database and display within the report.
To add new data rows to a section:
-
Select the section header row, then click the plus sign and select Add Data Row.
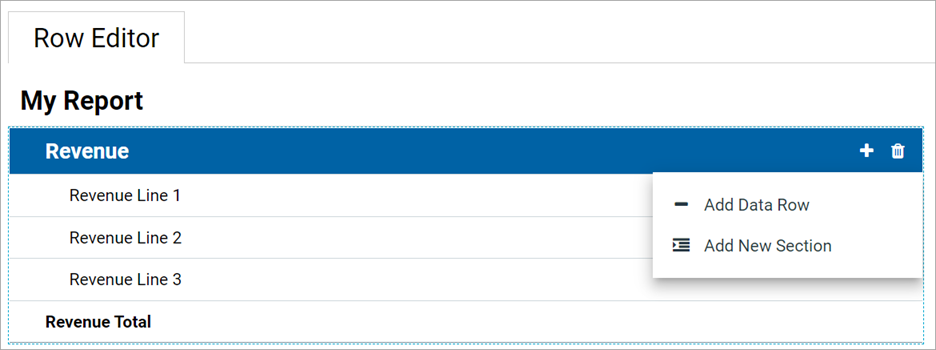
Option to add a new data row
The new row is added to the bottom of the section. You can continue to add as many new rows to the section as needed.
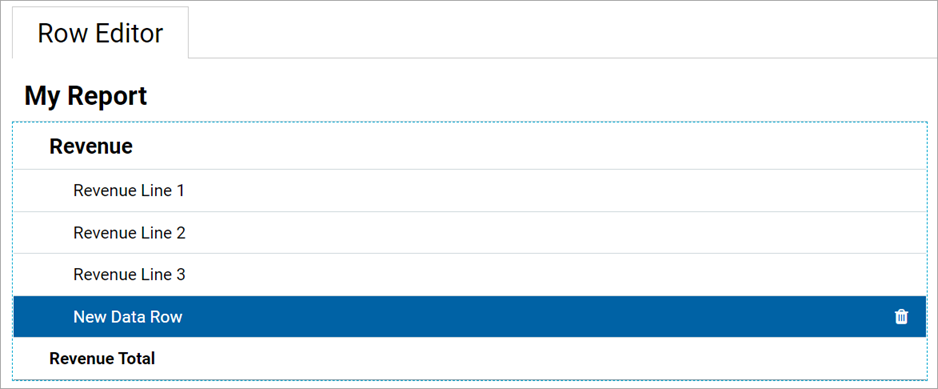
Section with a newly added data row
Once you have added data rows, you can make further row changes as follows:
-
To reorder rows: Select the data row that you want to move, and then drag and drop it to a new location within the same section. For example, if you want a newly added row to be at the top of the section instead of the bottom, then you can drag and drop it to that location. But you cannot drag and drop the row to a different section, not even to subsections of the current section.
-
To delete a row: Select the data row that you want to delete and then click the delete icon (trash can). The row is deleted.
IMPORTANT: Make sure you no longer need the row before clicking the delete icon. The row will be deleted immediately with no confirmation prompt. If you deleted a row by accident, then you can exit the row structure editor without saving, but you will also lose any other unsaved changes that you have made during the current session.
Only data rows can be individually added, deleted, and reordered. Section header rows and section total rows are not considered to be data rows and are managed as part of the section. Note the following:
- The delete icon on section header rows does not delete the header row; it deletes the entire section. If you do not want a particular section to have a header row, you can configure the section to hide the header row.
- Section total rows do not have delete icons. If you do not want a particular section to have a total row, you can configure the section to hide the total row.
- Section header rows are always located at the top of the section. When you drag and drop a section header row you are moving the entire section, not just the header row. It is not possible to move just the header row.
- Section total rows can be located at either the top or bottom of the section, but not by dragging and dropping. When you configure the section, you can specify the location of the total row.
To configure the properties for a data row, select the row and then complete the Row Properties in the right-hand pane.
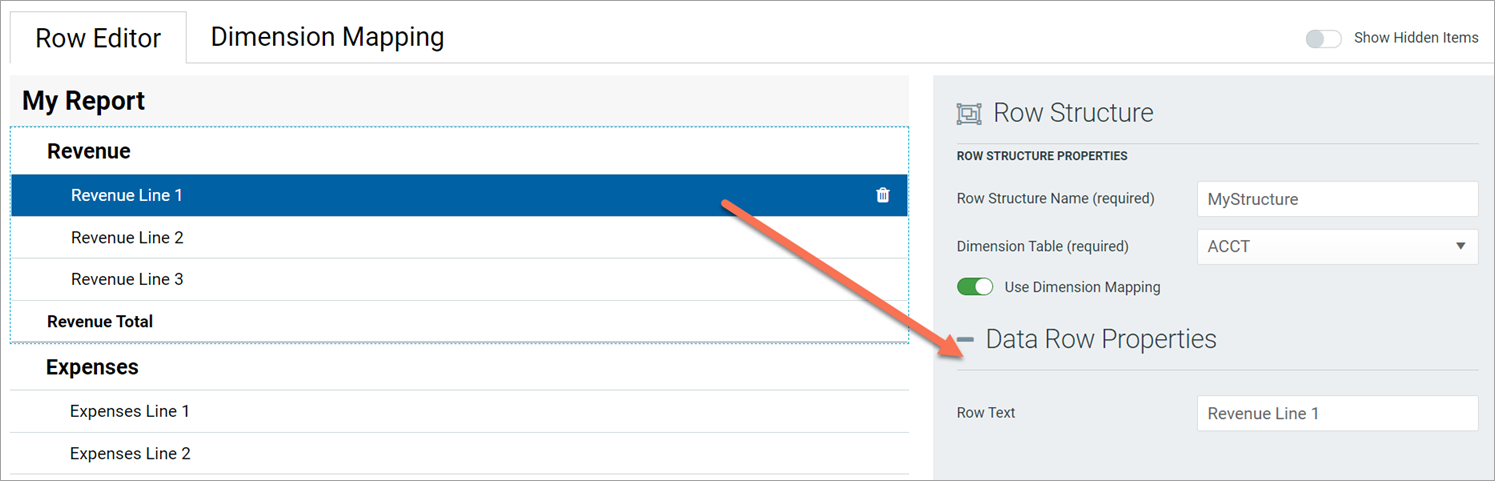
Example Row Properties area
| Item | Description |
|---|---|
|
Row Text |
The text to display on the data row. By default, this is set to "New Data Row". The row text should be edited to reflect the data shown on this row. For example, if this row is going to display data for the Travel account, the row text should be something like "Travel" or "Account 5000 - Travel". |
|
Data Filter |
A filter criteria statement to define the data to query into this row. Only applies when Use Dimension Mapping is disabled. If dimension mapping is enabled, then use the Dimension Mapping tab to map the data for this row. Row filters use normal filter syntax for Axiom Financial Institutions Suite. You can type the filter, or you can use the Filter Wizard to create a filter based on the specified Dimension Table for the row structure. For example, if the data filter is Each row's data filter is independent from any other row, and does not need to use the same grouping level or even the same dimension as other rows. For example, one row can be
|
If the row uses a data filter, then the row's data filter will be combined with any upstream section data filters (using AND). For example, imagine the row structure has sections and rows configured as follows:
| Parent Section Filter | Dept.Company='Company A'
|
|
| Current Section Filter | Dept.Region='US West'
|
|
| Row Filter | Acct.Acct=4000
|
Then the data for this row is determined as follows:
Dept.Company='Company A' AND Dept.Region='US West' AND Acct.Acct=4000
