AX1717
for web reports
The KPI Panel component displays key performance indicators (KPIs) in a series of eye-catching, automatically-formatted boxes. The design of the component is flexible to accommodate various numbers and display configurations.
The KPI Panel component displays each KPI using a primary value or status, and several optional supporting values. Each KPI can be shown with an optional bullet chart or sparkline chart. KPIs can be flagged as trending up or down, which is indicated using an arrow and a color (green for up, red for down). KPIs can also be configured to execute one or more actions using a button in the top-right corner or a fly-out menu.
The KPI values for the component must come from a KPI table. A KPI table is a special class of reference table that stores all of the properties necessary to display a KPI in the KPI Panel. The component reads the values from the specified table and displays them in the panel, using one KPI box per row of the table. You can define an optional filter on the component to determine which KPIs from the table display in the panel. If your system does not already have a KPI table, one must be created and populated before you can use the KPI Panel component in web reports.
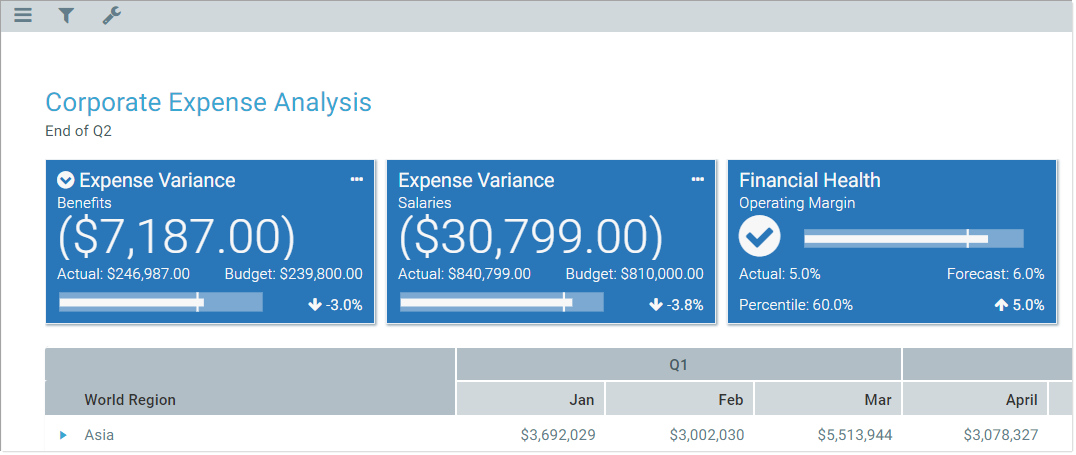
Example KPIs in a web report
How KPIs display in the component
The KPI Panel component depends on a predefined data structure so that it can automatically format and position the KPI data into a series of KPI boxes. KPI tables provide this data structure using a set of required columns that are automatically created when the KPI table is created. For more information about the KPI table structure, see About KPI tables.
The KPI boxes automatically flow within the KPI Panel component, from right to left and then down. If the component is sized wide and short, the KPI boxes will flow horizontally across the page. If the component is sized tall and thin, the KPI boxes will flow vertically down the page. The size and position of the KPI Panel is determined by the template; it cannot be changed within the web report.
The KPI boxes in the panel can display in a variety of ways, depending on the following:
-
KPI Kind: The kind specified for each KPI determines the information that displays in each KPI box. Basic KPIs emphasize numeric detail, whereas Status KPIs are intended to show whether a KPI is "good" or "bad" at a glance. Basic and Status KPIs can be mixed within the same panel.
-
Other KPI Properties: The various properties that are populated for each KPI affect the display of that KPI. For example, a Basic KPI can display either Value 4 or a chart, but not both.
-
KPI Size:
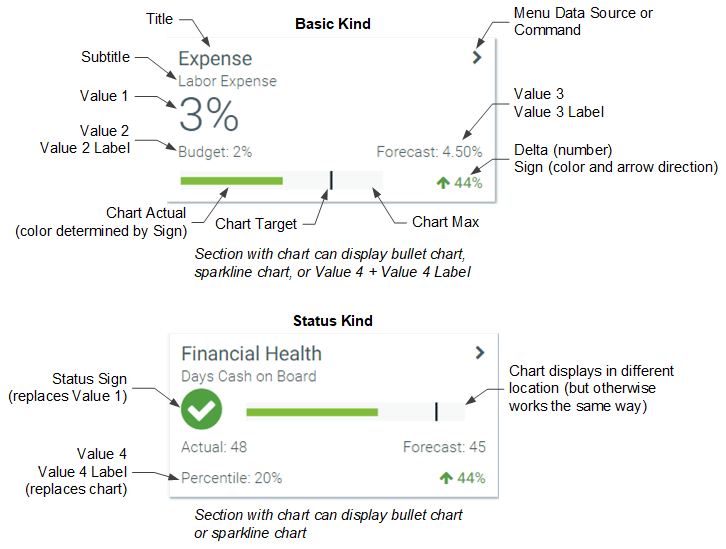
The following diagram shows how the major KPI properties are displayed in Basic and Status KPIs, so that you can see how the data structure maps to the presentation of KPI boxes.
The following screenshot shows some common variations on this structure:
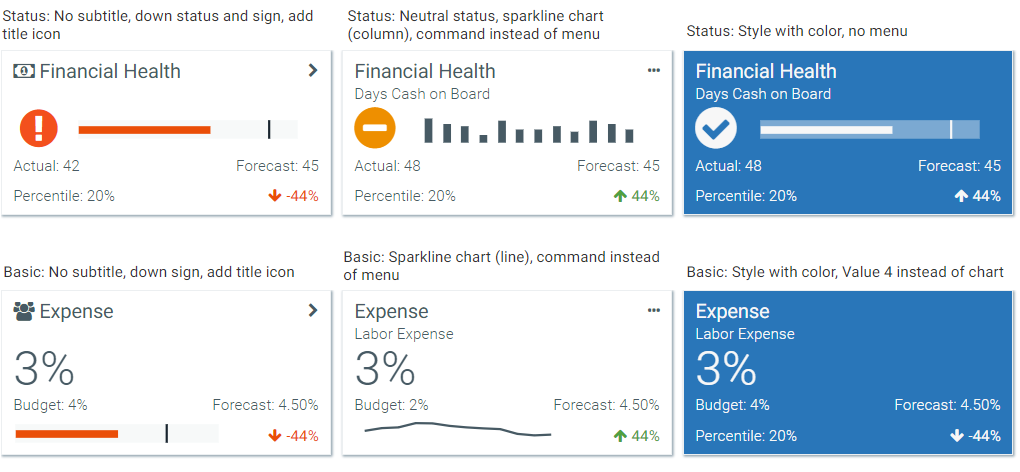
NOTE: If the value of any property is too long to display in its allotted space, the value is truncated and displays with an ellipsis. The full value is shown in a tooltip.
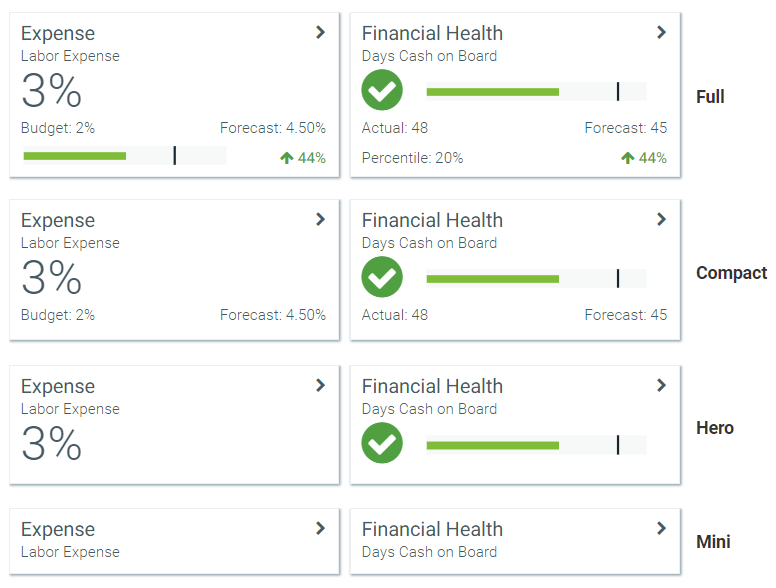
The following screenshot shows how the specified size affects the presentation of Basic and Status KPIs.
Component properties
You can define the following properties for a KPI Panel component. To configure component properties in the Report Designer, select the component in the report and then edit the properties as needed using the Components panel.
| Item | Description |
|---|---|
|
KPI Table |
The table that contains the KPI values to display in the component. Click the table icon In the Select a KPI Table dialog, the tables available for selection are determined as follows:
|
|
Filter |
Optional. A filter to limit the KPIs shown in the component. Click the filter icon NOTE: If the report has an associated file group, the tables in the Filter Wizard show with table variable names (as applicable), but the filter is not stored using these variable names. The filter does not update for changes to the table variable values. If no filter is defined, then all KPIs in the table display in the component by default (except for rows with the Hidden column set to True). If desired, you can set up refresh variable dependencies for the KPI Panel component, so that users can filter the KPIs shown in the component on demand. If the component has refresh variable dependencies, then any filter set here is applied in addition to any refresh variable values. |
|
Sort Order |
Optional. One or more columns to determine the sort order of the KPIs shown in the component. If no sort columns are specified, then by default the KPIs are sorted by the Name key column. Click the sort icon
If the report has an associated file group, and the KPI Table is the target of a table variable in the file group, then the sort order column is stored using the variable so that it can change dynamically. |
Defining refresh variable dependencies for KPI Panel components
KPI Panel components can be dependent on one or more refresh variables, so that users can filter the KPIs that show in the component on demand.
In order to create a dependency, the refresh variable must already be created on the Refresh Variables tab. For more information on creating refresh variables for web reports and how refresh variable dependencies work, see Configuring refresh variables for web reports.
In the Report Designer, refresh variable dependencies for KPI Panel components are defined in the Refresh Variable Dependencies section of the Components tab. If the currently selected component already has defined dependencies, they are listed in this section. Dependencies are listed by the name of the variable they are associated with.
To create a refresh variable dependency for a KPI Panel:
- In the Refresh Variables Dependencies section of the Components tab, click Add Dependency.
-
In the Create a Dependency dialog, complete the following:
Item Description Variable
Select the name of the variable that you want to associate with this component. You can select any variable defined on the Refresh Variables tab, except for Year variables. Year variables do not use dependencies.
The selected variable must reference the KPI table itself or a lookup table, in order to be valid for filtering the KPI Panel component.
Table Reference
This field only displays if the KPI table for the component has multiple column paths to the variable. In this case, you must select the column path that you want to use for this variable.
If the table has only one column path to the variable, then this field does not display. You do not have to configure the column association between the component and the variable because it is automatically set.
NOTE: If the KPI table for the component does not contain a path to the value column for the variable, the dependency cannot be created because there is no way to filter the KPI Panel based on the variable. In this case, the dialog displays a message "No dependencies available" after you select the variable name.
- Click OK to create the dependency.
Refresh variable dependencies cannot be edited once they are created. They can only be deleted. To delete a dependency, hover your mouse over the dependency in the list and then click the Delete icon![]()
NOTE: If you change the value column or hierarchy for the refresh variable after you create the dependency, the dependency will still work as long as there is only one path to both the original and the new value column or hierarchy (and assuming the new selection is still valid against the component). However, if the original dependency had a table reference, or if the new value column needs a table reference, then you must delete and re-create the dependency in order for the variable to work.
