AX1082
You can use the Sparkline content tag within a Grid data source to display a sparkline chart. Sparkline charts are minimal charts that are intended to be placed in context with related data, to display trends at-a-glance. In formatted grids, sparklines can be either traditional sparkline charts (using lines, columns, etc.) or bullet-style sparkline charts.
The Sparkline tag has no effect within the source file itself, but when the file is viewed as an Axiom form, the Sparkline tag will be resolved as a sparkline chart.
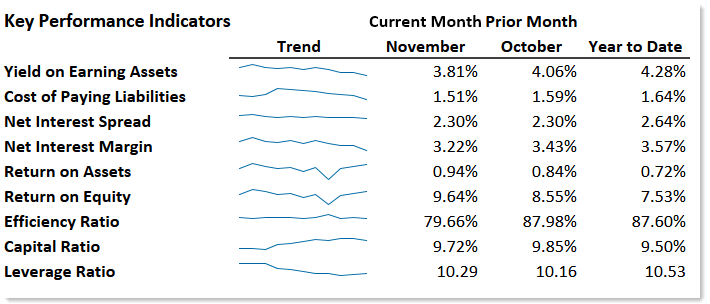
Example formatted grid using Sparkline tags
NOTE: Your Axiom Software license determines whether you have access to chart components. For more information, see Licensing requirements for Axiom forms.
Content tag syntax for sparklines
The syntax for the Sparkline content tag is as follows:
[Sparkline; DataSourceName=Sheet!DSName; SeriesName=Name; Href=URL; UseNewWindow=True/False; Background=Color; ColumnStyle=StyleName; Columns=Number]
Parameters can be listed in any order after the Sparkline tag. Optional parameters can be omitted.
To create the tag, you can manually type it within a cell, or you can use the Data Source Assistant / Tag Editor. For more information, see Creating and editing content tags in Formatted Grids.
| Parameter | Description |
|---|---|
|
DataSourceName |
The name of the data source to provide the data for the chart. This parameter uses the following syntax: SheetName!DataSourceName. For example: Sheet2!Executive. The specified data source must be either an XYChart data source (for regular sparkline charts) or a BulletChart data source (for bullet-style sparkline charts). See the following sections for more information on defining a data source for the sparkline chart. |
|
SeriesName |
The name of a series in the data source, to display that series in the chart. Typically sparkline charts display one series at a time. If omitted, then all series will display in the chart. Keep in mind that this may render the chart effectively illegible if there are more than a couple of series in the data source. NOTE: This parameter is required if the data source is a BulletChart data source. Only one series can display within a bullet-style sparkline. |
|
Href |
Optional. A URL to open when a user clicks on the chart in the Axiom form. For example, you can use this to open another Axiom form that displays the detailed data for the sparkline chart. For more information on options to open another Axiom form via a URL, see Generating a URL to an Axiom file or an Axiom form. Alternatively, you can use a bracketed cell reference to read the URL from the referenced cell. This approach is useful if you want to dynamically determine the URL, because then the formula can be in the referenced cell instead needing to construct the tag using a formula. For more information, see Referencing cells in content tag parameters. |
|
UseNewWindow |
Optional. Specifies whether the URL target will open in a new browser window (True/False). If omitted, the default is False, meaning the target will open in the same browser window (replacing the current window contents). File tabs opened within the Desktop ClientGeneral term for using either the Excel Client or the Windows Client, both of which are installed to the user's desktop. are treated the same as browser windows for this purpose. This parameter does not apply and should not be specified for URL targets that do not open in a browser window, such as when linking to spreadsheet Axiom files or plan file attachments. In this case, the parameter should always be omitted or set to False. |
|
Columns |
Optional. Specifies how many columns the cell contents will span in the grid. If this parameter is omitted or set to 1, then content generated by the tag will only span the current column. If you want the content to span multiple columns, enter a number such as 2 to span 2 columns. The column span extends to the right. NOTE: The row and column styles used in the grid impact how the column span displays. For example, if the content in the starting column is left-aligned and does not naturally exceed the width of the starting column, then the spanned columns will simply be blank because no content is extending to those columns. However, if the content is long enough to extend out of the starting column, or if the content has external borders (such as a text box), or if the content is center-aligned or right-aligned, then content will display in the spanned columns. |
|
ColumnStyle |
Optional. Specifies one or more column styles to apply to the current cell. The specified styles override the current column styles set by the Enter one or more valid column style names, separated by commas. If you are using the Data Source Assistant / Tag Editor, you can click the [...] button to open the Choose Styles dialog and select from available styles. The available styles depend on the skin specified for the form. For more information, see Using row and column styles with Formatted Grids. Alternatively, you can use a bracketed cell reference to read the style from the referenced cell. This approach is useful if you want to dynamically determine the style, because then the formula can be in the referenced cell instead needing to construct the tag using a formula. For more information, see Referencing cells in content tag parameters. |
Data source tags (regular sparkline charts)
Sparkline tags require a data source to be defined in the source file, to define the data to display in the chart. If you want to create a regular sparkline chart, you must use an XYChart data source. This is the same data source used by Line Charts, Column Charts, etc.
Note the following exceptions when using an XYChart data source for a sparkline chart:
-
Sparkline charts do not display axis labels or legends, so the
[XValueName]row and the[VisibleinLegend]column are not applicable. The[SeriesName]column must still be used to identify series in the data source, but the series names do not display in the chart. -
Sparkline charts only support one Y-axis scale, so the
[Axis]column is not applicable. If[Axis]is present in the data source and any series are assigned to the Secondary axis, those series will not display in the sparkline chart.
The tags for the data source are as follows:
Primary tag
Row tags
Column tags
The data source wizard only adds the [SeriesName], [XValue], and [Kind] columns. If you want to use any of the other columns, you must manually add them to the data source.
NOTES:
-
The primary tag must be placed in the first 500 rows of the sheet.
-
Formulas can be used to create the tags, as long as the initial bracket and identifying keyword are whole within the formula.
-
Negative numbers in a data source must use the minus symbol or parentheses to indicate the negative value. Alternative negative formats such as red number text are not recognized and will display as positive values in the chart.
To use the Data Source Wizard to add the tags to a sheet, right-click in a cell and then select Create Axiom Form Data Source. If the data already exists in the sheet, you can first highlight the labels and the values, and then use the wizard. When using the wizard, there is no separate option for Sparkline—instead you should select Line Chart or Column Chart, etc., based on what type of chart you want to display in the sparkline chart. Traditionally sparklines are line charts, but you can use any of the chart kinds supported by the XYChart data source.
To see an example data source, see the topic for the type of chart that you want to display as a sparkline. For example, if you want to display a Line Chart as a sparkline, see the topic for Line Chart component.
Data source tags (bullet-style sparkline charts)
Sparkline tags require a data source to be defined in the source file, to define the data to be displayed in the chart. If you want to create a bullet-style sparkline chart, then you must use a BulletChart data source.
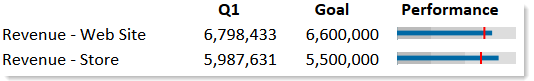
Example bullet-style sparkline charts
The tags for the data source are as follows:
| Tag Type | Tag Syntax |
|---|---|
|
Primary tag |
Data source names must be unique within a file and must start with a letter. Names can only contain letters, numbers, and underscores. Names are validated when the file is saved; an invalid name will prevent the save. The placement of this primary tag defines the control column and the control row for the data source.
|
|
Row tags |
[Series] Each series of data in the data source must be marked with a |
|
Column tags (required) |
[SeriesName] This column contains the name of each series in the chart. Each bullet chart can only display one series, but the data source can have multiple series. When you configure the content tag, you must specify which series to use for that chart. [Value] The current value for the series. [TargetValue] The target value for the series. [Minimum] This column indicates the minimum value of the bullet chart. If this tag is omitted, the minimum value of the chart is 0. This tag is not added by the data source wizard; you must manually add it to the data source if you need it. [Maximum] This column indicates the maximum value of the bullet chart. If this tag is omitted, the maximum value of the chart is 100. This tag is not added by the data source wizard; you must manually add it to the data source if you need it. |
|
Column tags (optional) |
BulletChart data sources can also use the following optional columns. These tags are not added by the data source wizard; you must manually add them to the data source if you need them. [TargetColor] This optional column indicates the color assignment for the target line on the bullet chart. If omitted, then colors will be dynamically determined based on the style, theme, or skin (in that order). You can use basic color names (for example, Blue) or you can enter valid hexadecimal color codes (for example #00FFFF for Aqua). [BarColor] This optional column indicates the color assignment for the bar on the bullet chart. If omitted, then colors will be dynamically determined based on the style, theme, or skin (in that order). You can use basic color names (for example, Blue) or you can enter valid hexadecimal color codes (for example #00FFFF for Aqua). |
| Column tags (ranges) |
BulletChart data sources can have up to 10 ranges. Typically bullet charts have 3 value ranges, indicating whether a value is considered poor, satisfactory, or good. If no ranges are defined, then no colored ranges will display on the chart. Range tags are defined as follows (use a number from 1 to 10 in the range tag as appropriate): [Range1Start] The start value of the range. [Range1End] The end value of the range. [Range1Color] The color of the range. You can use basic color names (for example, Blue) or you can enter valid hexadecimal color codes (for example #00FFFF for Aqua). If no color is defined, then shades of gray are used to differentiate each range. This tag is not added by the data source wizard; you must manually add it to the data source if you need it. NOTE: If you want the ranges to be continuous, then the end value of one range and the start value of the next range should be the same number—for example, if range 1 is from 0 to 20, then the start value for range 2 should be 20. |
Formulas can be used to create the tags, as long as the initial bracket and identifying keyword are whole within the formula.
The following example shows simple bullet chart data flagged in a sheet. In real implementations this data might be generated by an Axiom query or Axiom functions; here the data is simply typed in order to show the placement of the tags to the data.
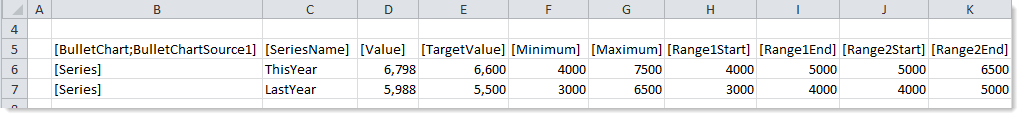
To use the Data Source Wizard to add the tags to a sheet, right-click in a cell and then select Create Axiom Form Data Source > Bullet Chart. If the data already exists in the sheet, you can first highlight the data (in the example above, you would highlight C6:K7) and then use the wizard. Axiom Software will add the tags as displayed in the example above. The cells in the row above and the column to the left of the highlighted area must be blank in order for Axiom to place the tags in sheet.
If adding the tags to existing values, the wizard assumes that the first column in the highlighted range holds series names, the second column holds values, and the third column holds target values. Any additional columns highlighted will be assigned as start / end range columns.
Behavior notes
- Tooltips do not display on sparkline charts within formatted grids.
- The size of the sparkline chart is dependent on the row height and column width of the cell where the Sparkline tag is placed.
Sparkline tag examples
[Sparkline;DataSourceName=Data!Executive;SeriesName=Yield]
This example will render a sparkline chart using the Yield series in the Executive data source. The Executive data source is an XYChart data source. The type of chart (i.e. line, column, etc.) and chart color will be determined by the data source.
[Sparkline;DataSourceName=Data!Executive;Href=document://\Axiom\SystemFolderName_ReportsLibrary\Forms\hierarchy.xlsx?ds=True;UseNewWindow=True]
This example is the same as the previous example, except a URL has been specified to open when a user clicks on the sparkline chart. In this case the Tag Editor was used to browse to a form-enabled document in the Axiom Reports Library; this will be interpreted as a URL in the Axiom form.
[Sparkline;DataSourceName=Data!Executive]
This example will render a sparkline chart using all series in the Executive data source.
