AX1675
web reports
You can create web reports in the Report Builder to report on Axiom Budgeting & Performance Reporting data using a lightweight, web-enabled reporting option.
In order to create a web report, you must have read/write access to at least one folder in the Reports Library, as defined in Axiom Budgeting & Performance Reporting security. Also, if you have access to My Documents, you can create and save web reports there.
The basic web report creation process is as follows:
-
You select a report template and define the name and folder location for the web report. The new web report is created using the selected template, and opens automatically in the Report Builder.
-
You optionally specify an associated file group for the report. This filters the available tables and columns based on the file group, and leverages table variables in the report configuration.
-
You define a data source for the report. All web reports have at least one data source that is used as the basis to query data for the report. The data source consists of a primary table and an optional filter.
-
You configure the components in the report to show the desired data and other display details, like titles. The template determines the components in the report and their layout.
The Data Grid component is the primary component used to display report data in web reports. To display data in the grid, you must add columns to the grid, set the sum by level for the grid, and configure other grid and column options.
-
You optionally define refresh variables for the report and set up dependencies to the data source. End users can use refresh variables to change the data shown in the report on-the-fly.
You can start the creation of a web report from either the Web Client or the Desktop Client. However, all web report creation and editing takes place in the Web Client. If you start the creation from the Desktop Client, you are automatically taken to the Web Client.
Creating a web report in the Web Client
In the Web Client, you can create new web reports using the Report Builder page.
To create a web report in the Web Client:
-
Click the menu icon
 in the left side of the Task Bar to open the Navigation panel. Then, select Report Builder.
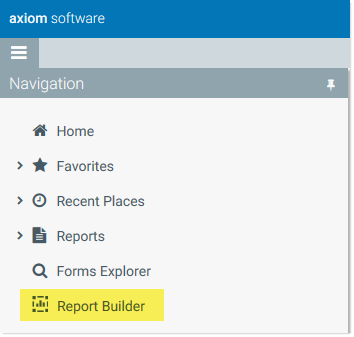
Alternatively, you can go to directly to the Report Builder page as follows:
Example On-Premise URL
http://ServerName/Axiom/Reports
Where ServerName is the name of the Axiom Application Server, and Axiom is the default name of the virtual directory.
Example Cloud System URL
https://CustomerName.axiom.cloud/Reports
Where CustomerName is the name of your cloud service system.
-
At the top of the Report Builder page, click New Report.
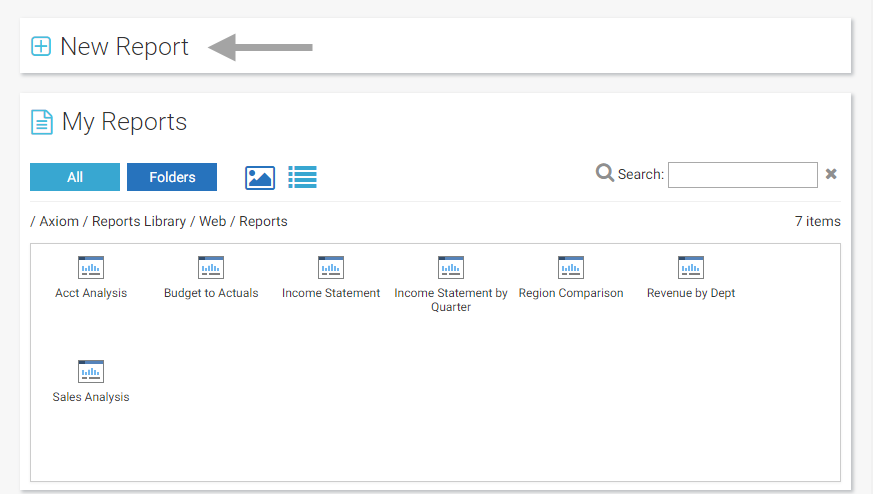
The Axiom Report Builder dialog opens.
-
In the Choose a Template screen, select the template that you want to use, and then click Next.
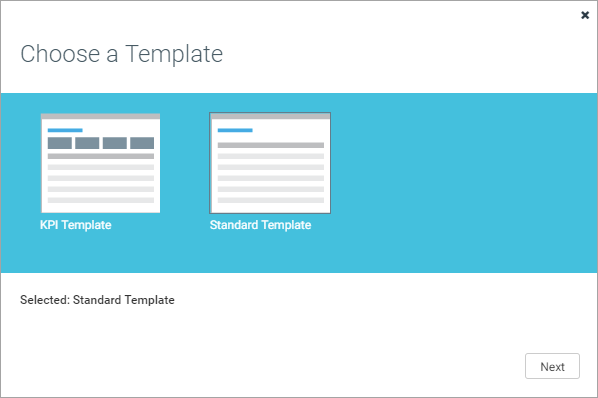
The template determines the report layout and the available components. Axiom Budgeting & Performance Reporting provides two templates by default:
- Standard Template: Standard report configuration with a title and a subtitle, and a data grid to display data.
- KPI Template: A variation of the standard template that displays key performance indicators (KPIs) plus a data grid.
Your organization can optionally create additional web report templates, and/or you may have licensed a packaged product that includes additional templates.
-
In the Report Settings screen, complete the following settings and then click Create:
-
Name: Type the name of the report.
-
Location: Click the folder icon to the right of the box to select a folder location. In the Select Folder dialog, you can select any folder in the Reports Library where you have read/write access . If you have access to the My Documents folder, you can also save the report there.
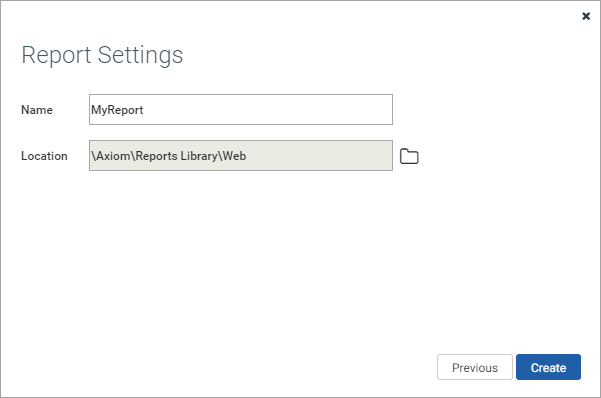
Example Report Settings screen
When you click Create, the new report is created by copying the selected template. The new report is then automatically opened in the Report Builder, with the Report Settings panel active.
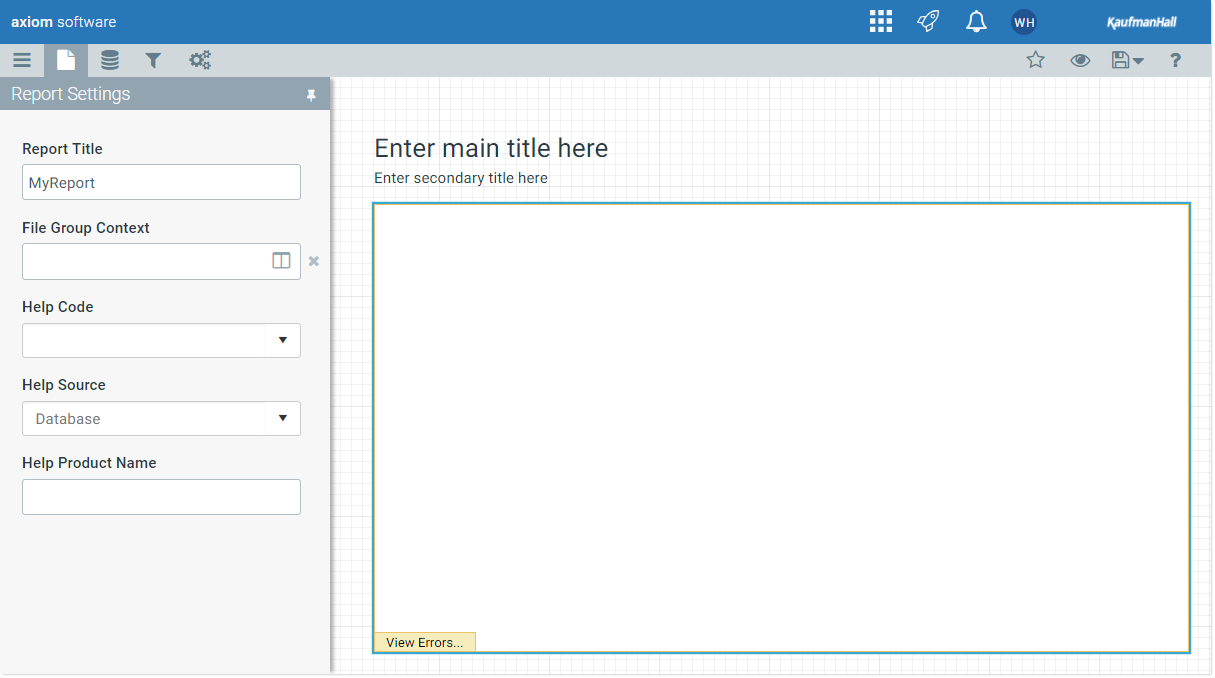
New report in the Report Builder using the Standard Template
The Report Builder is where you configure the report, including specifying a data source and configuring the components used in the report. For detailed information, see Using the Report Builder.
-
-
On the Report Settings panel

-
Report Title: Define a title for the report, to be displayed in the browser tab. By default, the file name is used as the report title if no alternate title is defined.
-
File Group Context: Select a file group if you want to associate this report with the file group. If a file group context is specified, the table variables in the file group are leveraged to streamline lists of available tables and to enable dynamic table and column references. For more information, see Associating a web report with a file group.
NOTE: If you plan to use a file group context, this selection should be made first, before configuring other areas of the report.
For more information on other report settings, see Defining general report settings.
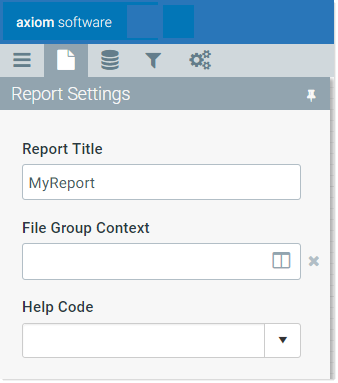
Example Report Settings tab of the Report Builder
-
-
On the Data Sources panel

By default, all web reports start with an initial data source, Datasource 1. You can edit this data source to specify a primary table and an optional filter, and you can change the name of the data source. You can also create additional data sources as needed. For more information, see Defining data sources for Data Grid components.
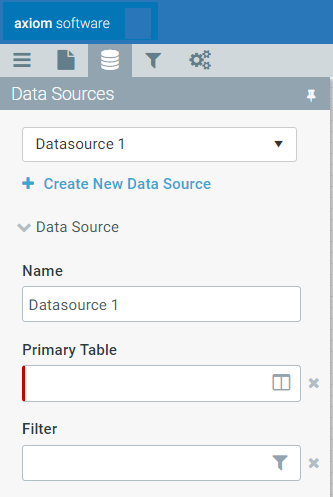
Example Data Source tab of the Report Builder
-
On the Components panel

For example, in the Standard Template provided by Axiom Budgeting & Performance Reporting, you should configure the following components:
-
TitledPanel_MainTitle and TitledPanel_SubTitle: These Label components define the main title text and the subtitle text for the report. Select each component and type the desired title text into the Text field.
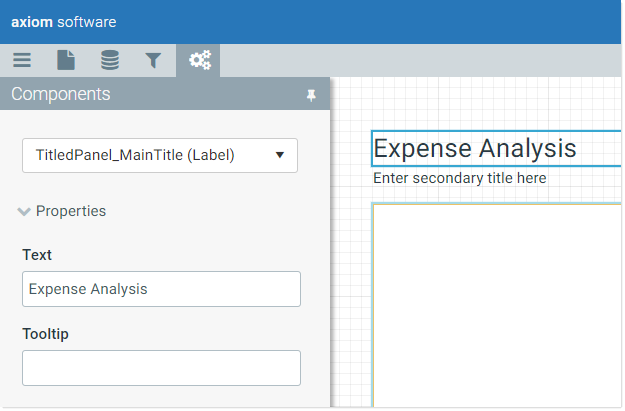
Example configured title text
-
PrimaryDataGrid: This Data Grid component should be configured to show the desired data. Select the component and then start adding table columns and calculations, set the sum by columns, and configure other grid and column properties.
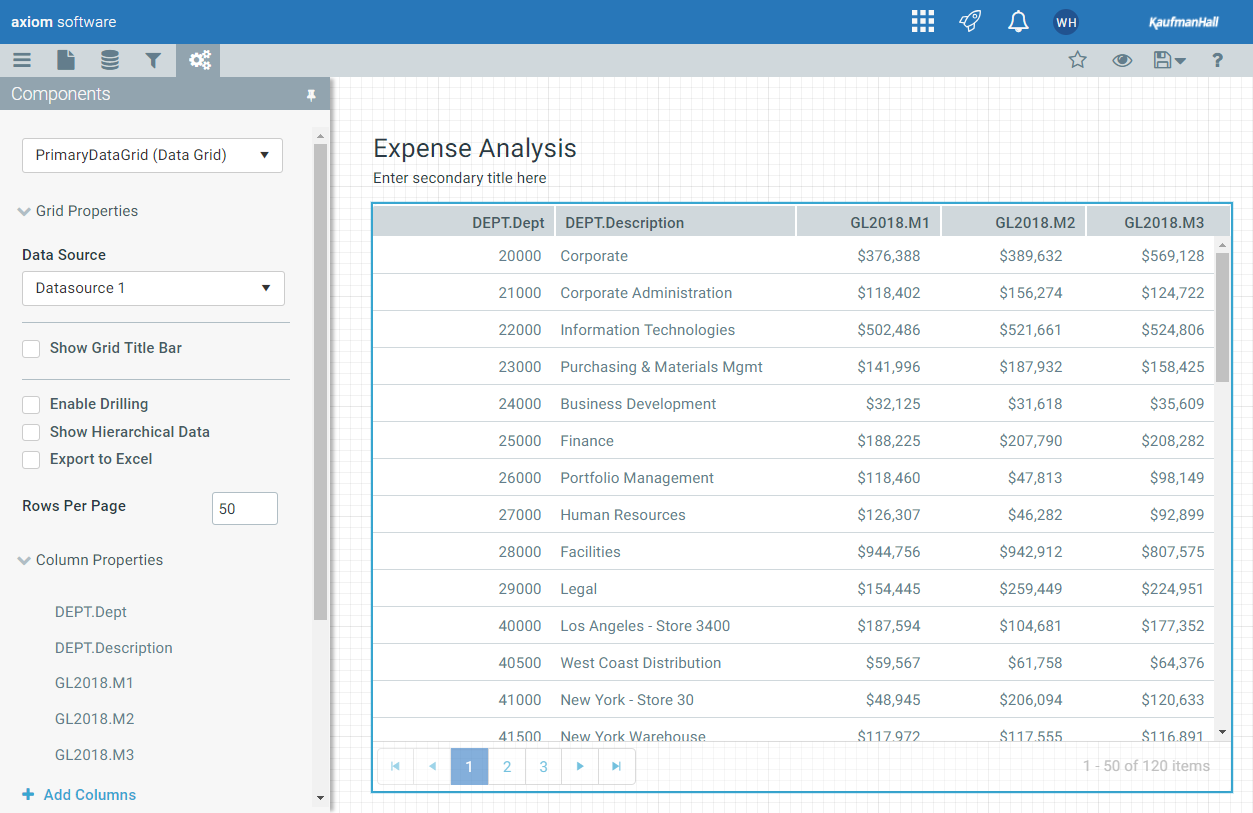
Example configured grid after adding columns and setting the sum level
NOTE: You must have completed the configuration of at least one data source before you can configure components that reference table data, such as the Data Grid component.
-
-
Optional. On the Refresh Variables panel


Example Refresh Variables tab of the Report Builder
For example, you could set up a refresh variable for Entity, so that the data grid would be filtered to only show data for the selected entity. To do this you would first create the variable, then set up a dependency between that variable and the data source used by the grid.
-
After making configuration changes, click the Save button in the top right corner to save the report.
You can also click the Preview button at any time to view and interact with the report as end users will see it. When you click Preview, the report is automatically saved. To return to the Report Builder from the preview, click Leave Preview.
For information on how to create a new web report in the Desktop Client, see Creating web reports (Desktop Client Help).
Creating a web report in the Desktop Client
In the Desktop Client (Excel Client or Windows Client), you can create new web reports using the Reports menu.
To create a web report in the Desktop Client:
-
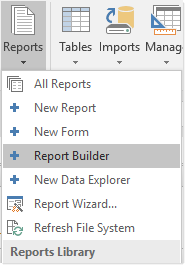
On the Axiom tab, in the Reports group, select Reports > Report Builder.
NOTE: If you are using an Axiom packaged product, this feature may be present on a different ribbon tab.
The Web Client opens to the Report Builder page, with the Axiom Report Builder already open. From this point, all creation activities take place in the Web Client.
-
In the Choose a Template screen, select the template that you want to use, and then click Next.
The template determines the report layout and the available components. Axiom Budgeting & Performance Reporting provides two templates by default:
- Standard Template: Standard report configuration with a title and a subtitle, and a data grid to display data.
- KPI Template: A variation of the standard template that displays key performance indicators (KPIs) plus a data grid.
Your organization can optionally create additional web report templates, and/or you may have licensed a packaged product that includes additional templates.
-
In the Report Settings screen, complete the following settings and then click Create:
-
Name: Type the name of the report.
-
Location: Click the folder icon to the right of the box to select a folder location. In the Select Folder dialog, you can select any folder in the Reports Library where you have read/write access . If you have access to the My Documents folder, you can also save the report there.
Example Report Settings screen
When you click Create, the new report is created by copying the selected template. The new report is then automatically opened in the Report Builder, with the Report Settings panel active.
New report in the Report Builder using the Standard Template
The Report Builder is where you configure the report, including specifying a data source and configuring the components used in the report. For detailed information, see Using the Report Builder.
-
-
On the Report Settings panel
-
Report Title: Define a title for the report, to be displayed in the browser tab. By default, the file name is used as the report title if no alternate title is defined.
-
File Group Context: Select a file group if you want to associate this report with the file group. If a file group context is specified, the table variables in the file group are leveraged to streamline lists of available tables and to enable dynamic table and column references. For more information, see Associating a web report with a file group.
NOTE: If you plan to use a file group context, this selection should be made first, before configuring other areas of the report.
For more information on other report settings, see Defining general report settings.
Example Report Settings tab of the Report Builder
-
-
On the Data Sources panel
By default, all web reports start with an initial data source, Datasource 1. You can edit this data source to specify a primary table and an optional filter, and you can change the name of the data source. You can also create additional data sources as needed. For more information, see Defining data sources for Data Grid components.
Example Data Source tab of the Report Builder
-
On the Components panel
For example, in the Standard Template provided by Axiom Budgeting & Performance Reporting, you should configure the following components:
-
TitledPanel_MainTitle and TitledPanel_SubTitle: These Label components define the main title text and the subtitle text for the report. Select each component and type the desired title text into the Text field.
Example configured title text
-
PrimaryDataGrid: This Data Grid component should be configured to show the desired data. Select the component and then start adding table columns and calculations, set the sum by columns, and configure other grid and column properties.
Example configured grid after adding columns and setting the sum level
NOTE: You must have completed the configuration of at least one data source before you can configure components that reference table data, such as the Data Grid component.
-
-
Optional. On the Refresh Variables panel
Example Refresh Variables tab of the Report Builder
For example, you could set up a refresh variable for Entity, so that the data grid would be filtered to only show data for the selected entity. To do this you would first create the variable, then set up a dependency between that variable and the data source used by the grid.
-
After making configuration changes, click the Save button in the top right corner to save the report.
You can also click the Preview button at any time to view and interact with the report as end users will see it. When you click Preview, the report is automatically saved. To return to the Report Builder from the preview, click Leave Preview.
For information on how to create a new web report in the Web Client, see Creating a web report (Web Client Help).
In order to edit an existing web report, you must have read/write access to that report, as defined in Axiom Budgeting & Performance Reporting security.
Web reports can only be edited in the Web Client. Although you can open existing web reports from within the Desktop Client, you cannot edit them in that client. Once the report is open, all editing activities take place in the Web Client.
Only one user at a time can open a web report for editing in the Report Builder. If another user attempts to edit a web report while it is locked to another user, then it can only be opened as read-only. When a report is opened as read-only in the Report Builder, no changes can be saved, but Save As can be used to save a copy of the file. Although the report is locked for editing, other users can continue to view the report outside of the Report Builder as normal.
To edit a web report:
-
Open the report that you want to edit.
-
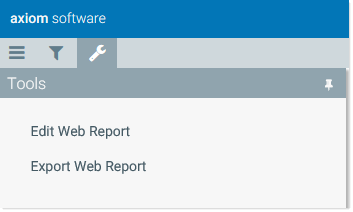
In the gray task bar, click the wrench icon to open the Tools menu, then select Edit Web Report.
The web report opens in the Report Builder.
- Using the Report Builder panel, edit the web report as needed. For more information, see Using the Report Builder.
-
After making configuration changes, click the Save button to save the report.
You can also click the Preview button at any time to view and interact with the report as end users will see it. When you click Preview, the report is automatically saved. To return to the Report Builder from the preview, click Leave Preview.
Web reports cannot be deleted in the Web Client; they must be deleted in the Desktop Client (Excel Client or Windows Client).
In order to delete a web report, you must have read/write permission to the parent folder.
-
On the Axiom tab, in the Administration group, click Manage > Axiom Explorer.
TIP: You can also use the Explorer task pane to delete a web report.
NOTE: If you are using an Axiom packaged product, you can access this feature from the Admin tab. Click System Browser to open Axiom Explorer.
-
Navigate to the Reports Library, and then locate the web report that you want to delete.
-
Right-click the report and then select Delete.
