New KPI display options
In addition to the KPI kinds and sizes, several new display options were added to KPIs. You can now optionally specify the following:
- Subtitle
- Additional supporting value (Value4)
- Sparkline chart (instead of the default bullet chart)
- Menu to display several commands (instead of the default single command)
These changes apply to KPI Panel components used in either Axiom forms or the Report Builder.
Subtitle
The KPISource data source and KPI tables now have a Subtitle column to display an optional subtitle for KPIs. The subtitle displays in smaller text underneath the main title, for all KPI kinds.
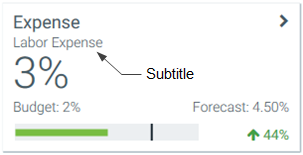
Example KPI with subtitle
Additional supporting value
The KPISource data source and KPI tables now have the following columns to display an additional supporting value for KPIs:
- Value4
- Value4Label
Value4 and its label display in the bottom row of the KPI, on the left-hand side. When using the Basic kind, Value4 and the chart are interchangeable, so you can display one or the other. If both are defined, the chart takes precedence.
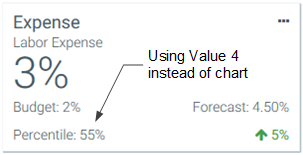
Example Basic kind with Value4
When using the Status kind, the chart displays in a different location so you can display both if desired.
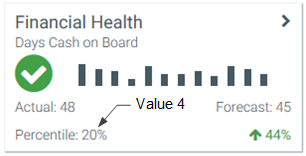
Example Status kind with Value4
Sparkline charts
You can opt to display a sparkline chart in KPIs instead of the default bullet chart. The KPISource data source has the following new columns to display a sparkline chart:
- SparklineDataSource: The name of an XYChart data source defined in the spreadsheet. Line charts and column charts both use XYChart data sources.
- SparklineSeriesName: The name of a series in the XYChart data source. Line and column series can be used.
For example, the sheet may contain an XYChart data source named Sparkline, with two series. One is a line series named LineSeries and the other is a column series named ColumnSeries.
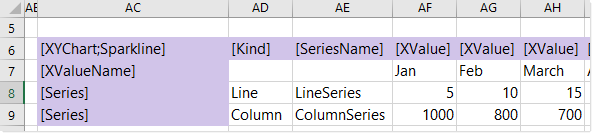
Example XYChart data source
To display these series as sparklines in KPIs, the XYChart data source name and series names are listed in the KPISource data source:
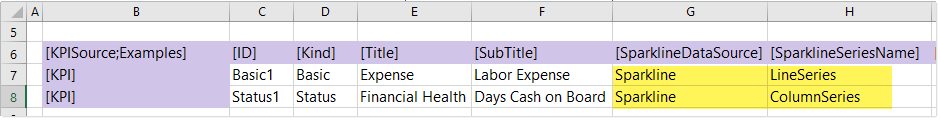
Example KPISource data source referencing sparkline series
When the KPIs are rendered, Axiom Software finds the specified series in the specified XYChart data source, and displays the data as a sparkline chart. For example:
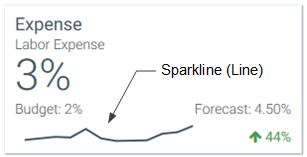
Example Basic kind with sparkline

Example Status kind with sparkline
You can also use sparkline charts when the KPIs are sourced from a KPI table rather than a KPISource data source. The KPI table contains a new column, SparklineData, to store the sparkline data for KPIs. In this case, the save-to-database report that you are using to save the KPI data to the table must be set up as follows:
-
The file must contain an XYChart data source that is configured to display sparkline data, such as the example XYChart data source shown previously.
-
When setting up Save Type 1 in the file, the contents of the SparklineData column must contain the following special syntax to specify the XYChart data source and series:
[Datasource=DataSourceName;Series=SeriesName]. For example: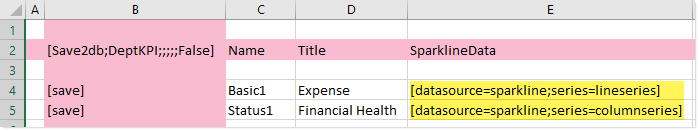
When the save-to-database is executed, Axiom Software finds the designated XYChart data source, and converts the contents of the specified series into an XML string. That XML string is then saved to the SparklineData column in the KPI table. When the KPI table is used with a KPI Panel component, the XML string is used to render the sparkline chart on the KPI box.
Menu
You can now configure a custom menu for each KPI box, in order to display multiple actions to execute. The menu is an alternative to using the existing Command column, which allows you to execute a single command from the top right corner of the box. The KPISource data source now has a MenuDataSource column, to specify the name of a KPIMenu data source.
Using the KPI Menu data source, you can define multiple menu items for display on a KPI box, including the menu item name, icon, tooltip, and command. Menu items can also be dynamically flagged as disabled or hidden. The following screenshot shows an example KPI menu data source with three items.
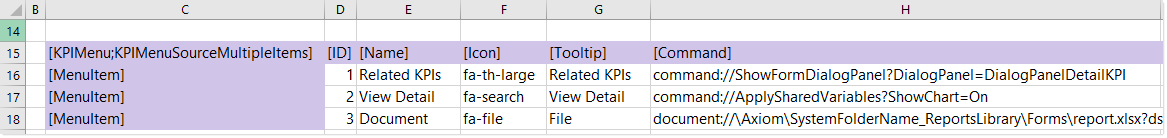
Example KPIMenu data source
When the KPIMenu data source has multiple items, a carat icon displays in the top right corner of the KPI box. Users can click the icon to open the menu. If the KPIMenu data source has just one visible item, the associated icon displays in the top right corner instead of the carat icon, and users can click the icon to execute the associated command directly.
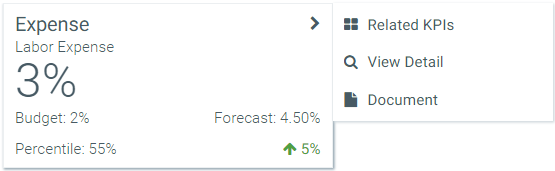
Example KPI with menu
You can create a new KPIMenu data source using the right-click menu: Create Axiom Form Data Source > KPI Menu. Valid commands are the same items that are supported for the Command column: web URLs, document shortcuts, and commands from the Command Library.
You can also use a KPIMenu data source when saving KPI values to a KPI table. The KPI table contains a new column, MenuData, to store the menu data for KPIs. To do this, the save-to-database file that you use to save KPI data to the table must be set up as follows:
-
The file must contain a KPIMenu data source. This data source is set up as normal, on any sheet of the file.
-
When setting up Save Type 1 in the file, the contents of the MenuData column must contain the following special syntax to specify the KPIMenu data source to save:
[Datasource=DataSourceName]. For example: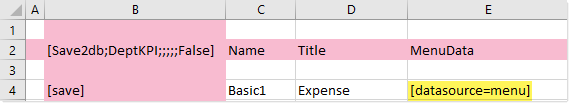
When the save-to-database is executed, Axiom Software finds the designated KPIMenu data source, and converts the contents of it into an XML string. That XML string is then saved to the MenuData column in the KPI table. When the KPI table is used with a KPI Panel component, the XML string is used to render the menu on the KPI box.
NOTE: When using a KPI table with a KPI Panel component in the Report Builder, commands from the Command Library are not supported. This applies to the Command column and the MenuData column. Any commands used must be web URLs or document shortcuts.
Upgrade behavior
Existing KPI Panel components are not affected by the introduction of these new features.
-
If you are using a KPISource data source, the new columns are not present in existing data sources. You can add the columns manually (or use the Data Source Assistant) and populate them as desired.
- Although the associated columns are automatically added to any existing KPI tables, these columns will be blank and therefore will not affect any existing KPIs. If you want to use the new features, you must modify your save-to-database report to populate the columns as desired as part of the save.
In both cases, if you are updating existing KPIs to use new features, you should also specify a kind for each KPI.
