Payor Summary for Deduction Models report
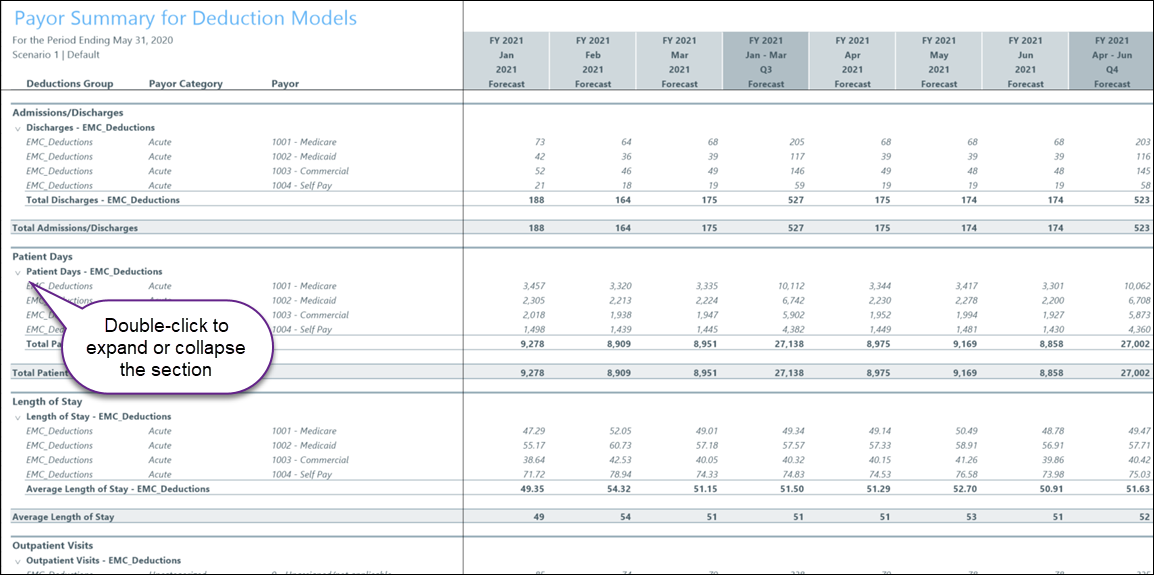
The Payor Summary for Deduction Models report aggregates the forecast data from one or more deduction models and displays it in three main sections:
- Metrics – Patient deduction and revenue statistics, presented in collapsible sub sections
- Summary – Totals for patient revenue, deductions, and reimbursement
- Details – Details by payor where applicable. Includes Administrative Adjustments, Charity, and Bad Debt data independent of selected payor categories.
Access the report in Axiom Assistant
If you have administrative user permissions, access the report using the following path:
Admin > Admin Task Panes > Rolling Forecasting Admin > Reporting > RF Payor Summary for Deduction Models
If you do not have administrative user permissions, access the report using the following path:
Main > Navigation > Explorer > Libraries > Reports Library > Rolling Forecasting Reports > Global Workforce Opportunity
Refresh variables
The following table explains the refresh variables that are available for this report:
| Field | Description |
|---|---|
| Select Deductions Group(s) (Leave blank for All) | Select the Deductions Group from the Choose Value dialog. You can select multiple groups. |
| Select Uncategorized Payors |
To include only payors that do not belong to any payor category, select the check box. NOTE: This check box is available only if you created payor deduction categories in the Payor Setup Utility. If you select this check box, the Select Payor Category field disappears. |
| Select Payor Category (Leave blank for all) |
Do one of the following:
NOTE: This field is available only if you created payor deduction categories in the Payor Setup Utility. |
| Select Scenario | Select the scenario to apply to the report data. |
| Select RF Deductions Model Option (optional) |
To use an alternate configuration to present data in a format that is more consistent with outpatient reporting, select one of the following:
|
| Select Number of Actual Periods | Select the number of periods of past data (actuals) to include in the report. You can include up to two years and two months (26 months) of data. |
| Select Number of Forecast [periods] | Select the number of periods of future data (forecast) to include in the report. You can include up to two years and 10 months (34 months) of data. |
After you select the refresh variables, click OK to generate and open the report.
NOTE: When viewing the report, you can change the criteria to view different sets of data or data grouped in different ways. On the Main ribbon tab, click Refresh Data, and then change the selections in the dialog.
TIP: The default report view is by month, but you can switch the view to quarters using the Change View option in the Main ribbon tab.