Metric Comparison report
The Metric Comparison report compares volume, revenue, expense, and profitability measures, by department and entity, to discern how metric options differ. This helps you make the better informed selections for each department or entity.
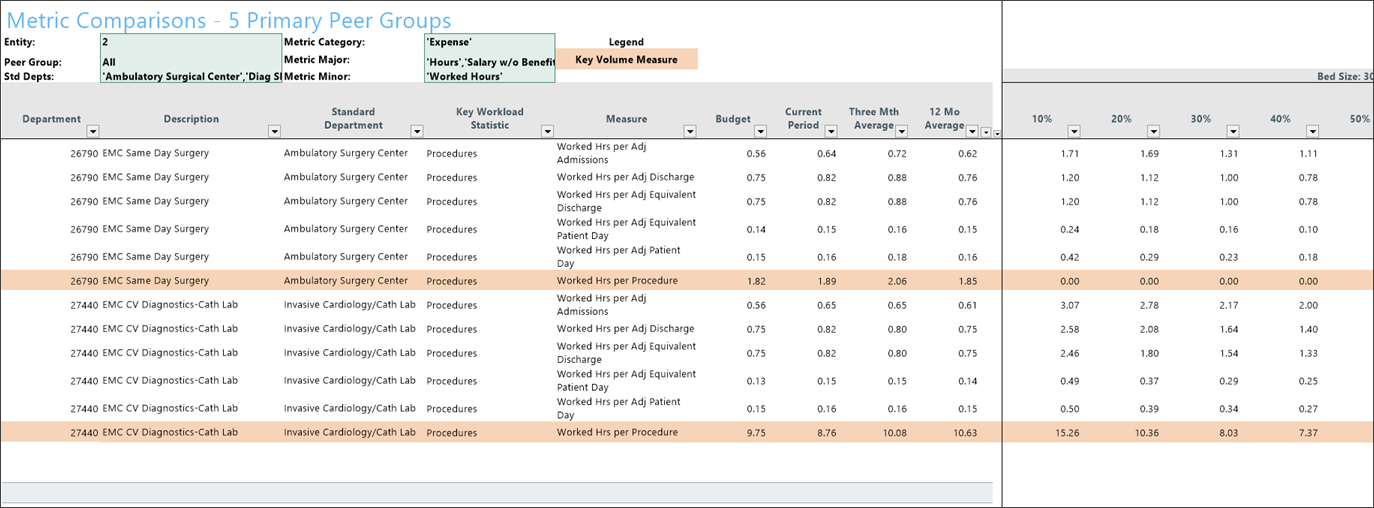
Features of this report
-
Key metrics are highlighted in orange where applicable to provide quick reference to what is currently selected compared to other provided metrics
-
You can select one or more peer groups
-
You can configure metric percentiles in 5% or 10% increments
Access the report in Axiom Assistant
If you have administrative user permissions, access the report using the following path:
Admin > Admin Task Panes > Comparative Analytics Admin > Reports > Metric Comparison
If you do not have administrative user permissions, access the report using the following path:
Main > Navigation > Explorer > Libraries > Reports Library > Comparative Analytics Reports > Metric Comparison
Refresh variables
Double-click Metric Comparison to open the Refresh Variables dialog, through which you can customize the data that appears in the report. The following refresh variables are available for this report:
| Refresh variable | Description | Required |
|---|---|---|
| Select Benchmarks Type |
On the dropdown, select the benchmark (Department or Entity) to assign to the report. Default is Department. |
Yes |
| Select Entity | Click Choose Value, select the entity to assign to the report, and then click OK. | Yes |
| Select Peer Groups |
Click Choose Value, select the peer groups to associate with the selected entity, and then click OK. Available options depend on the Benchmarks Type selection. |
No |
| Select Dept(s) | Click Choose Value, select the departments to associate with the report, and click OK. | No |
| Select Metric Type | Click Choose Value, select the metric types to associate with the report, and click OK. | No |
| Select Metric Major Category | Click Choose Value, select the metric major category to associate with the report, and click OK. | No |
| Select Metric Minor Category | Click Choose Value, select the metric minor category to associate with the report, and click OK. | No |
| Select Metrics | Click Choose Value, select the metrics to associate with the report, and click OK. | No |
| Select Period | Click Choose Value, select the time period (month and year) in which to run the report, and click OK. | Yes |
| Select Percentile Increment |
On the dropdown, select the benchmark percentile increment (5% or 10%) to associate with the report. Default is 10%. |
Yes |
NOTE: To remove data from the fields listed above, click the Clear value icon (![]() ). When you are choosing a value to assign to the report (Entity), use the filter field at the top of the Choose Value dialog to customize the items that appear in a list.
). When you are choosing a value to assign to the report (Entity), use the filter field at the top of the Choose Value dialog to customize the items that appear in a list.
After you select the refresh variables, click OK to generate and open the report.
