Cost benchmarks
Available Medicare cost benchmarks
Cost data covers total, direct, and indirect costs. Cost benchmarks can be a valuable tool for your hospital. Cost data can be utilized to determine where your organization has opportunities for improvement on a cost basis. If your costs are greater than the cost benchmarks, there may be an opportunity to look at areas for cost reduction. For example, cost benchmarks are useful when analyzing pharmacy costs by MS-DRG or APR-DRG and severity of illness (SOI). If pharmacy costs are greater than the Medicare benchmark by MS-DRG or APR-DRG/SOI, you can dig deeper to find which medications cost the most through the Physician Service Details section or the Treatment Analysis section.
How cost benchmarks are computed
Since we do not receive encounter-level benchmark data, cost benchmarks are calculated using a ratio of cost to charges (RCC) and should be treated as an approximation. Cost benchmarks are available when using Medicare peer groups and for some all payer peer groups.
For each hospital in the peer group and for each revenue code group, the total charge amount from the time period in the benchmark profile and the total cost are computed, then we calculate the Ratio of Cost to Charges:
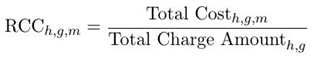
The subscripts h, g and m indicate that this is a separate computation for each hospital (h) in the peer group, each revenue code group (g) and each mode (m) – Direct, Indirect and Total – as defined in the definition tables. Cost and charge amount are totaled over all charges from the hospital in the cost bucket during the relevant time period.
To illustrate, consider how RCC would be calculated for Accommodation – Coronary Care and Accommodation – Intensive Care for St. Lupulin in the following example:
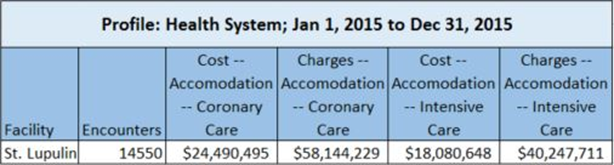
In this view, we are looking at costs and charges from St. Lupulin for the revenue code groups Accommodation – Coronary Care (Revenue Codes 0210, 0211, 0212, 0213, 0214 and 0219) and Accommodation – Intensive Care (Revenue Codes 0200, 0201, 0202, 0203, 0204, 0206, 0207, 0208, 0209). The cost values for each category are obtained by summing the costs from all charges with the corresponding revenue codes from the year 2015. The total charge values are obtained the same way using charge amounts from the same charges. Note that these charges come from 14,550 different encounters.
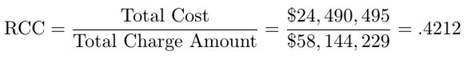
Based on these numbers, we would calculate a Total Cost for Coronary Care RCC of:
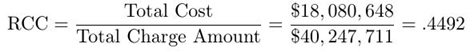
We can also calculation the Total Cost for Intensive Care RCC:
Computations like this are made for each facility in the peer group, for each revenue code group in the revenue code measures table and for each mode of cost. Since there are 45 different revenue codes in the cost measures table and 3 different modes of cost, there are 45x3=135 different RCC values associated with each facility in a peer group. If a peer group contained 21 facilities, there would be a total of 135x21=2,835 different RCC values associated with the peer group.
For an encounter from a peer group where encounter-level cost data is not available, we estimate cost using the RCC values. For example, if a patient at St. Lupulin had a total charge amount from intensive care of $120,022, we would estimate the patient’s total cost from intensive care to be:

The cost for each encounter in a peer group is estimated using this procedure with the RCC values associated with the encounter’s facility. Once we have an estimated cost for every encounter, we compute a benchmark value for each measure using the same procedure as for benchmark charge values.
Analysts can see peer group cost benchmarks for most revenue code groups. For more information on revenue code groups, see Revenue Code measures.
The cost benchmark data is accessible from any part of Clinical Analytics that currently shows charge data, such at the Details Section or the Charges and Costs Detail Section.
Contact Support if you have questions or to have the cost benchmarks loaded into Clinical Analytics.
Use the Charges and Costs Detail section
One way to use the cost data is through the Charges and Costs Detail section. You can choose between charge and cost data via a dropdown at the top of the section.
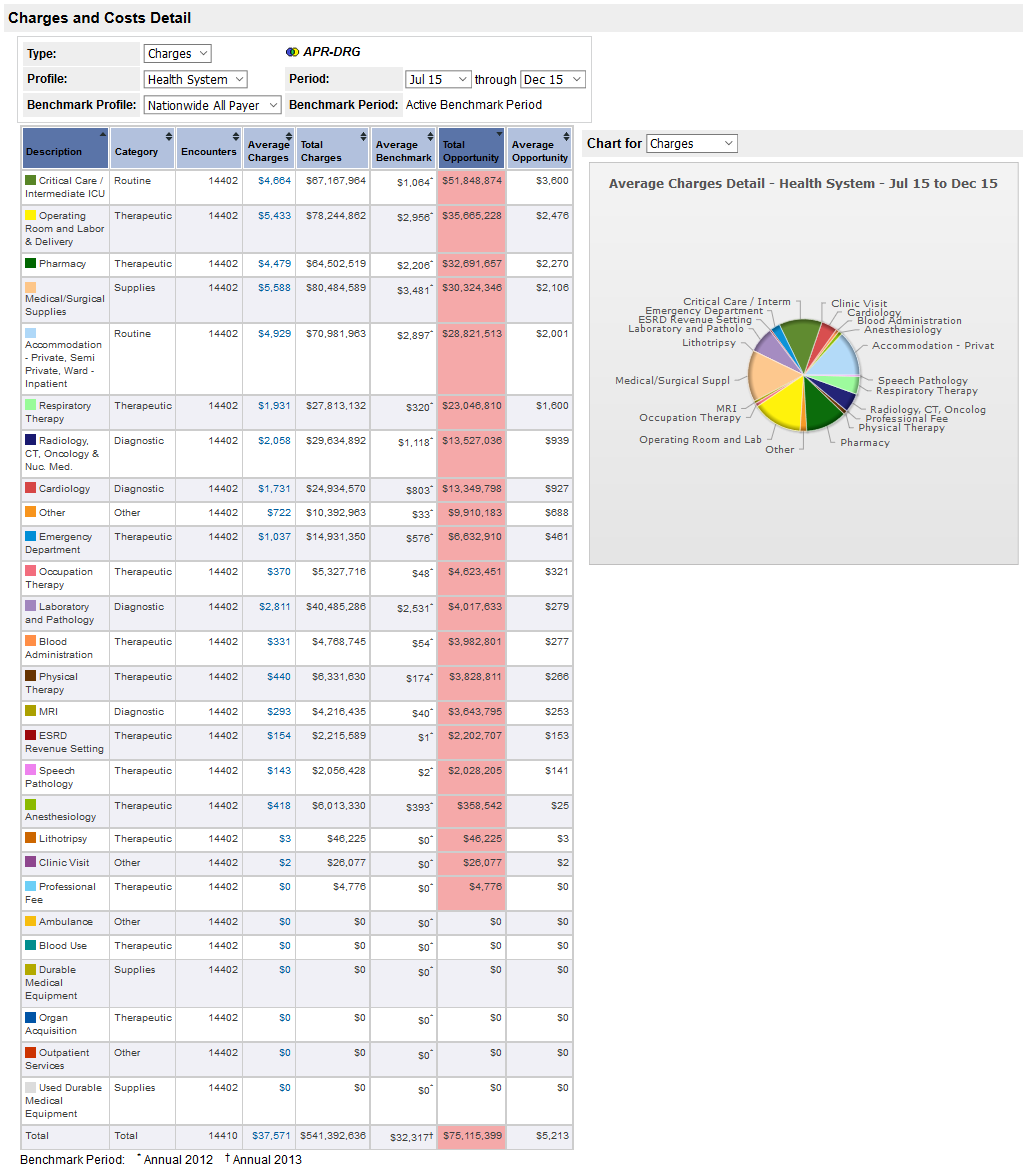
The data table and pie chart provide a quick overview of where your facility’s costs or charges are relative to the benchmark. For a full explanation of the calculations in this table, see Charge and Cost Measure calculations, or you can download the PDF version.
You can also toggle between charges/costs and opportunities in the pie chart. The opportunity chart shows where your facility can improve based on the benchmarks. The full calculations and cost report fields for all cost measures are listed in the Medicare cost formulas table.
Revenue code groups are listed in the Revenue Code categories table or you can see the revenue codes associated with each Cost measure in Charge and Cost measures.
