Benchmark data sources
The following lists the sources of data for external benchmarks available on your server. For questions or for help accessing this data, contact Support.
The following maps indicate the data made available by each state.
- 2021 MedPAR Data
- All-Payer Data
- National Readmission Database (NRD)
- October 2021 - September 2022 CMS Hospital Compare Data
NOTE: In case you missed the latest email, download the Benchmark Data Release Notes (April 2021).
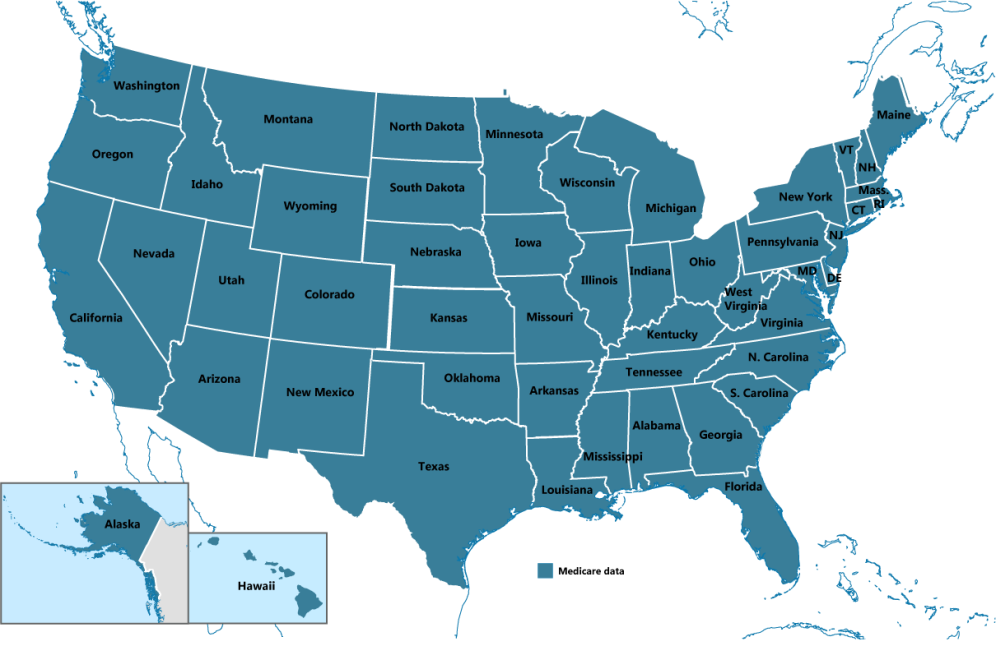
2020 MedPAR Data
Clinical Analytics receives inpatient Medicare data from MedPar for all 50 states.
All-Payer Data
Clinical Analytics has All-Payer data from several states; the maps below show which patient types are available from each state. Note that these maps indicate where data are available, not necessarily where data are included from.
Inpatient All-Payer Data
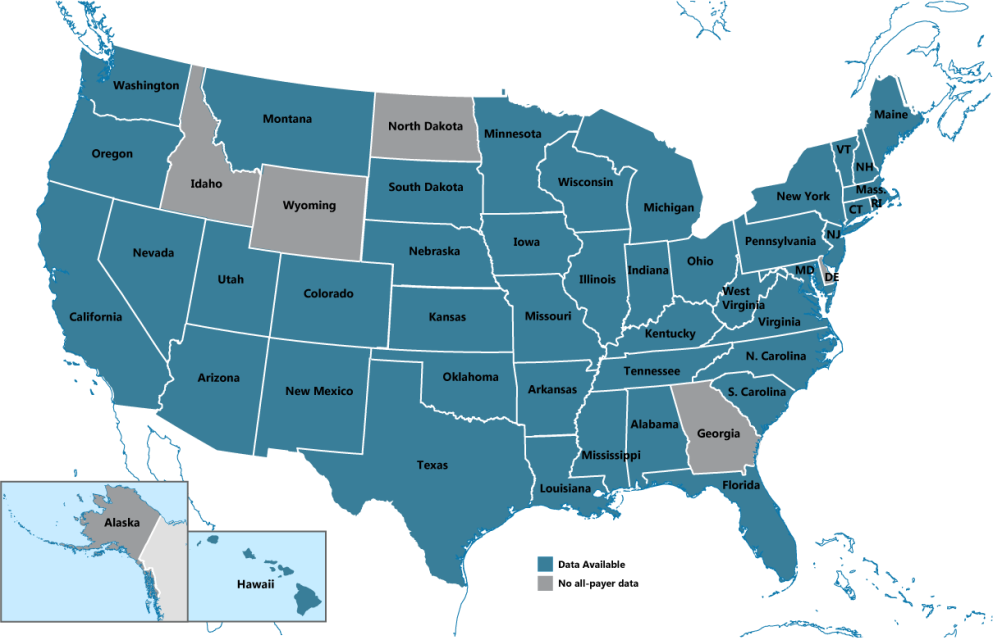
2020 All-Payer Data
This data set includes the following states:
- Florida
- Iowa
- Maryland
- Pennsylvania
- Rhode Island
- Texas
- Vermont
- Virginia
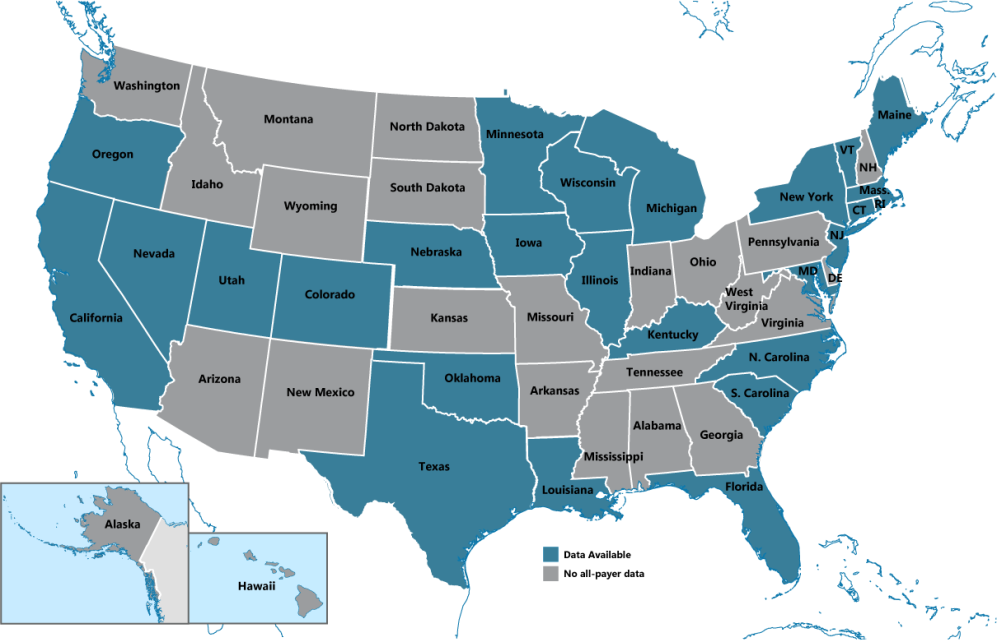
2019 All-Payer Data
This data set includes the following states:
- California*
- Iowa
- Maine
- Nevada
- New Hampshire
- New York
- Pennsylvania
- Rhode Island
- Texas
- Vermont
- Virginia
*Restricted to current clients
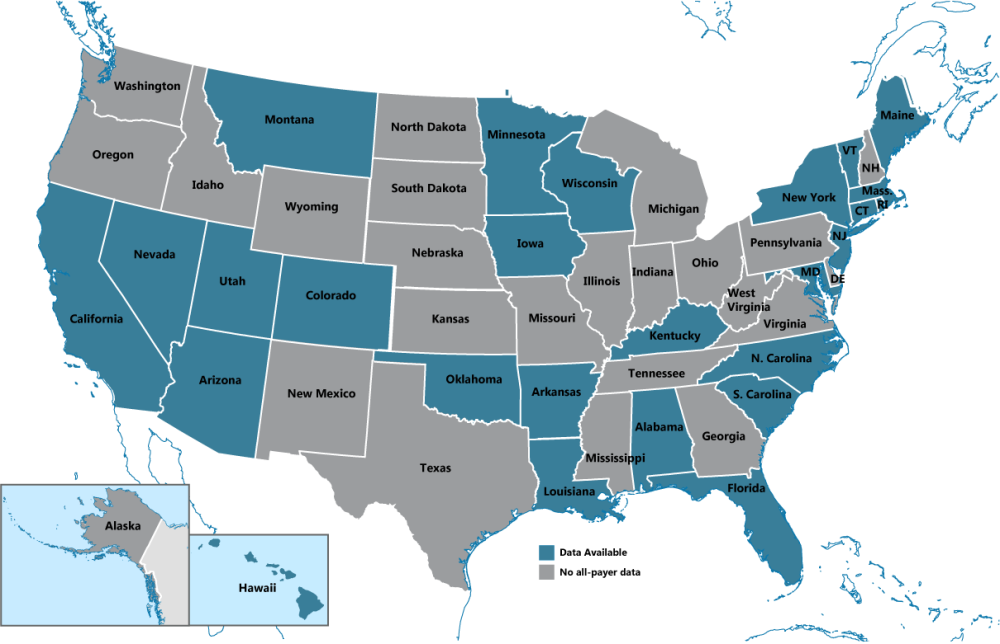
2019 All-Payer Revenue Code Data
All-Payer revenue code benchmark data includes:
- Iowa
- Nevada
- New York
- Pennsylvania
- Texas
- Vermont
2018 All-Payer Revenue Code Data
All-Payer revenue code benchmark data includes:
- Iowa
- Massachusetts
- Nevada
- New York
- Pennsylvania
- Texas
- Vermont
Ambulatory Surgery Center (ASC) All-Payer Data
Emergency Department (ED) All-Payer Data
National Readmission Database (NRD)
External readmission rate benchmarks are built using the 2019 National Readmission Database. There are 4 All Payer peer groups for utilizing the NRD data:
- NRD Nationwide (All Payer)
- NRD – Bedsize – Small (All Payer)
- NRD – Bedsize – Medium (All Payer)
- NRD – Bedsize – Large (All Payer)
NOTE: The Bedsize assignments are specified within the NRD dataset and not determined by Clinical Analytics. For more information, see https://www.hcup-us.ahrq.gov/db/vars/hosp_bedsize/nrdnote.jsp.
DRG-level external benchmarks for readmission rates are available for the following measures
- 3 Day Readmission Rate Forward
- 7 Day Readmission Rate Forward
- 10 Day Readmission Rate Forward
- 14 Day Readmission Rate Forward
- 30 Day Readmission Rate Forward
- 1 to 30 Day Readmission Rate Forward
- 90 Day Readmission Rate Forward
- 180 Day Readmission Rate Forward
Due to the intent of benchmarks, readmission measure definitions, and the nature of the NRD data, external benchmarks are NOT available for any of the same-day, same-hospital or backward readmission rate measures. There are also no benchmarks for the 1-year readmission rate measures, as the NRD includes only one year of data and encounters are not linkable between years.
Facility-level external benchmarks for readmission rates are available for the following measures
- CMS 30-Day Hospital-Wide Readmissions
(Benchmarks are facility-level)
- 30 Day All Cause Readmission Rate - Cardio-Respiratory Cohort
- 30 Day All Cause Readmission Rate - Cardiovascular Cohort
- 30 Day All Cause Readmission Rate - Medical Cohort
- 30 Day All Cause Readmission Rate - Neurology Cohort
- 30 Day All Cause Readmission Rate - Surgical Cohort
- 30 Day All Cause Readmission Rate - Roll Up All Cohorts
- CMS 30-Day Procedure-Specific Readmissions
- 30 Day Readmission Rate - CABG Cohort
- 30 Day Readmission Rate - THA/TKA Cohort
- CMS 30-Day Condition-Specific Readmission
- 30 Day Readmission Rate - AMI Cohort
- 30 Day Readmission Rate - COPD Cohort
- 30 Day Readmission Rate - Heart Failure Cohort
- 30 Day Readmission Rate - Pneumonia Cohort
- 30 Day Readmission Rate - Stroke Cohort
From AHRQ's HCUP NRD Website
The NRD is drawn from the HCUP State Inpatient Databases (SID) and can be used to create estimates of national readmission rates for all payers and the uninsured. The 2019 NRD was constructed from 27 States with reliable, verified patient linkage numbers in the SID that could be used to track the patient across hospitals within a State, while adhering to strict privacy guidelines.
Key features of the 2019 NRD include:
- A large sample size, which provides sufficient data for analysis across hospital types and the study of readmissions for relatively uncommon disorders and procedures.
- Discharge data from 27 geographically dispersed States, accounting for 57.8 percent of the total U.S. resident population and 56.6 percent of all U.S. hospitalizations.
- Designed to be flexible to various types of analyses of readmissions in the United States for all types of payers and the uninsured.
- Criteria to determine the relationship between multiple hospital admissions for an individual patient in a calendar year is left to the analyst using the NRD.
- Outcomes of interest include national readmission rates, reasons for returning to the hospital for care, and the hospital costs for discharges with and without readmissions.
- The NRD is designed to support national readmission analyses and cannot be used for regional-, state-, or hospital-specific analyses.
October 2019 - September 2020 CMS Hospital Compare Data
External benchmarks for the following measures utilize CMS Hospital Compare Data for October 2019 - September 2020:
- Core Measures
- See Core measures for more information.
- Patient Satisfaction Data (HCAHPS)
- See HCAHPS measures for more information.
