Performance tab
The Performance tab provides highlights of which Clinical Analytics pages are used most frequently and which take the longest to load.
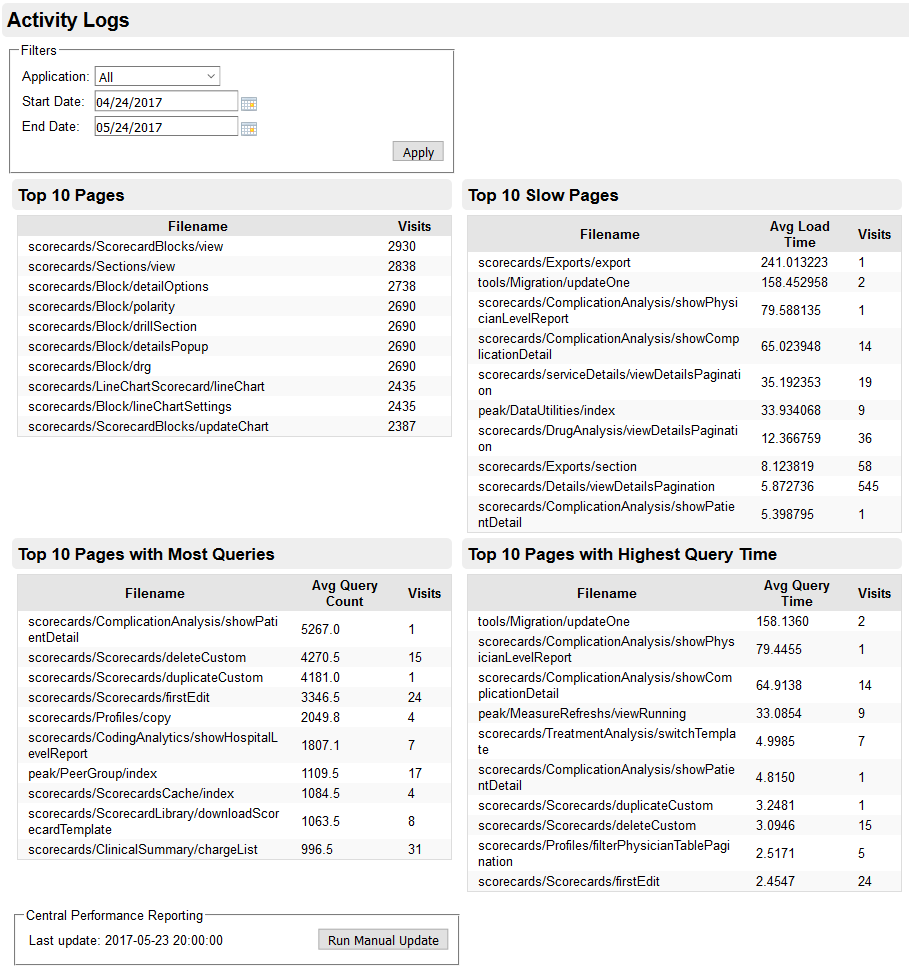
Activity logs
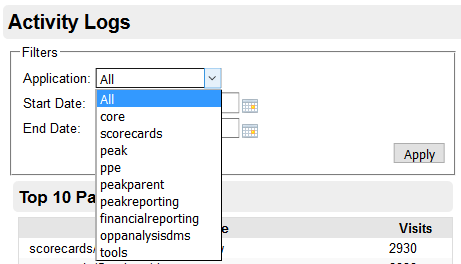
Similar to downloadable logs on the User Logs tab, here you can select the activity you would like to see by application. This selection applies to the four sections of this page.
Top 10 Pages
This is an at-a-glance way to see which features are used the most in Clinical Analytics. Keep in mind that many of these features appear because the section is loaded in a scorecard. We can see that the top two items are viewing Blocks and Sections in Scorecards and most of the rest of the list pertains to loading the individual items within a Two Column Section. While this doesn't mean that each of these visits represents a person analyzing a speedometer or line chart, it does mean that most scorecards likely contain a few Two Column Section Blocks.
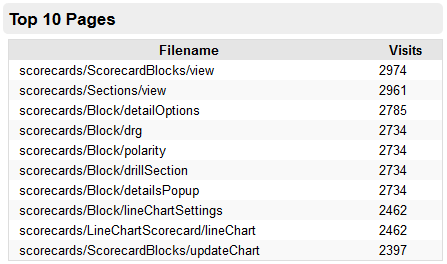
You can limit what you see in this list by selecting a certain application or time frame at the top of the page, which you may find particularly helpful for this table.
Top 10 Pages with Most Queries
This table list how many times each page was visited and the average number of queries run for each visit. We can see that Complication Analysis requests a lot of information in Clinical Analytics, which is not surprising.
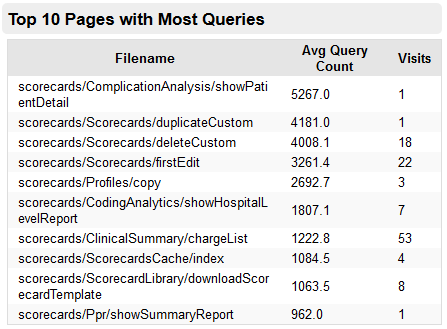
Keep in mind that you can limit what you see in this list by selecting a particular application or time frame at the top of the page.
Top 10 Slow Pages
As the name suggests, this table lists which pages take the longest to load (from when you click to when you see what you wanted), on average. You can also see how many times the page was visited (loaded).
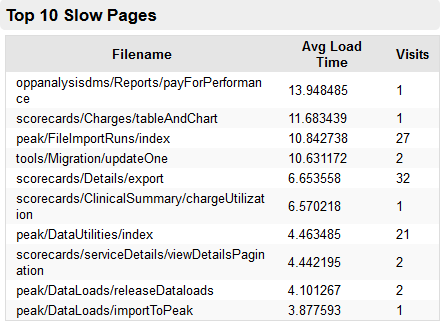
Selecting a particular application or time frame at the top of the page may help you find more meaningful information in this table.
Top 10 Pages with Highest Query Time
Avg (average) Query Time is the amount of time, in seconds, it takes for the server to respond (send back data) from when you request data (click Rerun, for example). This table also shows you how many times the data was requested. In the example below, we can see that Complication Analysis seems to be taking a while (about 1 minute) on this server. Clinical Analytics uses this information to identify which pages should be looked at for performance optimization opportunity.
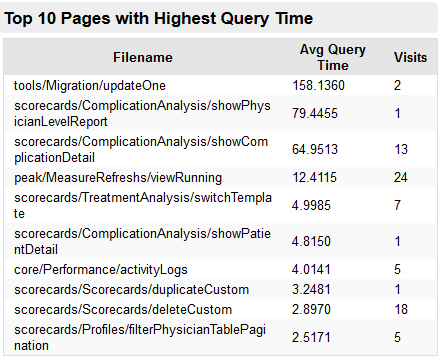
Keep in mind that you can limit what you see in this list by selecting a particular application or time frame at the top of the page.
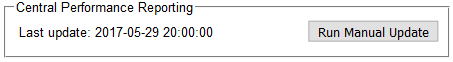
Central Performance Reporting
You shouldn't ever need to worry about running a manual update; this process is done automatically by the server and does not affect what you see in Clinical Analytics.