Statistical Process Control
While we would like to understand industry standards for statistical process control (SPC) before jumping to the section, if you're already an SPC expert and want to get right to specific information about the SPC section, see About the Statistical Process Control section.
About Statistical Process Control
To understand the intent and functionality of the Statistical Process Control section, it helps to understand industry standards for this analytic tool. See About Statistical Process Control for more information about the research behind this section. We have designed the Statistical Process Control section to guide your targeted analysis of patient cohorts so you can focus your process improvement efforts.
Cohort definitions
The cohorts for Statistical Process Control are explicitly defined in terms of diagnosis codes, procedure codes, DRGs, and discharge dispositions. This is to ensure that all encounters represented on a control chart have similar medical conditions with similar indicated treatments and expected outcomes. For a full list of available cohorts and definitions, see Cohort definitions.
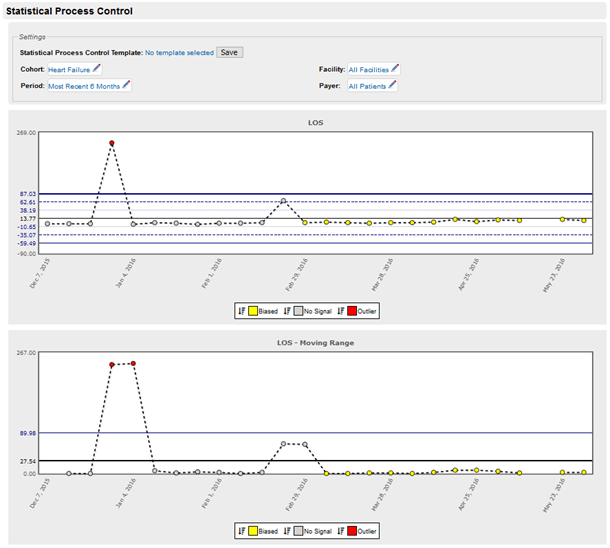
About Control Charts
While a control chart may seem similar to the line charts you see in the Two Column Section, they are different in design and intent. See About Control Charts for more information about the design of these visuals.
SPC Measure definitions
The SPC measures are available throughout Clinical Analytics. See SPC Measure definitions for a list of all the measures found in the SPC section.
Adjustment calculations
Measure values are adjusted to minimize external sources of variation so signals you see in your charts are representative of actionable opportunity. See SPC calculations for more details.
About the SPC section
Thank you for taking the time to read the above topics! You are now ready to read About the Statistical Process Control section to understand Clinical Analytics's application of these industry-standard concepts.
