Clinical Case Summary
Clinical Case Summary (CCS) is one of the most unique and insightful pieces of your Clinical Analytics Software solution because it is a detailed look at a single patient encounter, including demographics, diagnoses, procedures, HCAHPS data, and more. CCS is not a standalone section you can add to your scorecard, but can be easily drilled to from several places in Clinical Analytics by any user with Encryption & unlocking permissions.
Access CCS
Access Clinical Case Summary from:
- Clinical Case Summary Lookup: Type the Account Number or Axiom Encounter ID for the encounter into this section to be taken to the CCS for the encounter.
- Hyperlinked Axiom Encounter ID values: Throughout the software, many sections display Axiom Encounter IDs; simply click a blue hyperlinked value to be taken to the CCS for that encounter.
- Coding Analytics: Patient Detail Report shows hyperlinked Axiom Encounter ID values.
- Potentially Preventable Complications Report (PPCs): Setting the Report Focus to Patient or drilling into the PPC Adjusted APR-DRG on the Diagnosis Details page shows hyperlinked Axiom Encounter IDs.
- Details: When you add a group-by for Axiom Encounter ID, the Details table shows encounter-level data and the values in the Axiom Encounter ID column are hyperlinked.
- Frequent Readmissions report: Setting View Type to Detail shows the encounter Account Number; clicking this hyperlink takes you to the CCS for that encounter.
- Last Day of Service: The Patient Report Displays the hyperlinked Axiom Encounter IDs.
- Potentially Preventable Readmissions report (PPRs): Drilling through the summary reports to the Detail level shows you the hyperlinked Axiom Encounter IDs.
CCS basics
Along the top of the Clinical Case Summary, the Account Number of the encounter, the randomly-generated Axiom Encounter ID assigned to the encounter, and the date the patient was admitted all appear.
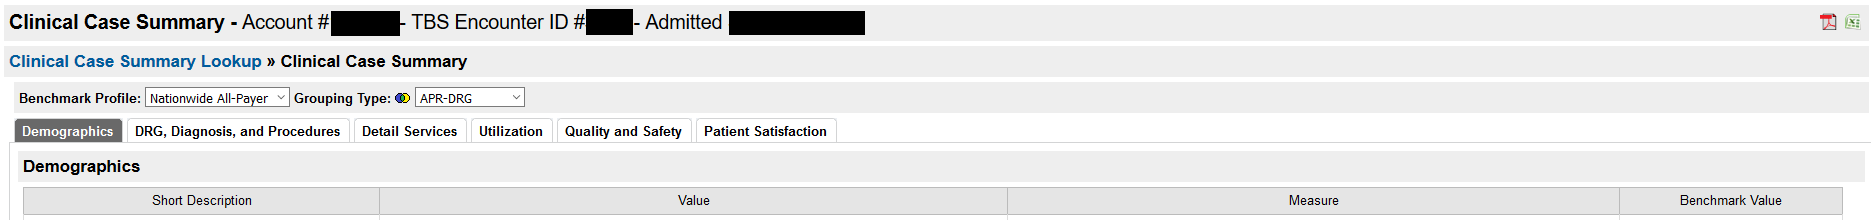
Below those details, the breadcrumb trail shows where you drilled to CCS from; click the blue hyperlinked text to return to the section you drilled from.

On the third line, you can select the Benchmark Profile and Grouping type; these selections apply to the opportunity calculations on the Utilization, Quality and Safety, and Patient Satisfaction tabs.
CCS tabs
Clinical Case Summary has six tabs:
- Demographics
- DRG, Diagnosis, and Procedures
- Detail Services
- Utilization
- Quality and Safety
- Patient Satisfaction
- Physician Attribution
Demographics
The Demographics tab provides a quick overview of the patient encounter, including patient information, admit/discharge details, Physicians, Nursing Units, and Coders. The Related Records section is for mother/baby linked records so you can switch over to the CCS for the related encounter.
| Row name | Description |
|---|---|
| Axiom Encounter ID | Unique patient identifier assigned by Clinical Analytics. |
| Patient Account Number | Unique patient identifier received by Clinical Analytics. |
| Medical Record Number | Additional encounters for the same patient. Clicking this hyperlinked value displays the Axiom Encounter ID, Admit Date, Discharge Date, and Patient Type for all encounters with that MRN. This is a quick way to see readmissions or summarize the visit history of patients with several encounters. |
| Patient Type | Inpatient, Observation, Emergency Department, Outpatient, or Ambulatory Surgery. |
| Gender | As received by Clinical Analytics. |
| Patient Age | |
| Patient ZIP Code | |
| Payer ID | |
| Payer | |
| Facility ID | |
| Facility | |
| LOS | Integer value LOS calculated by Clinical Analytics. |
| Admit Date | As received by Clinical Analytics. |
| Admit Hour | |
| Admit Day of Week | |
| Discharge Date | |
| Discharge Hour | |
| Discharge Day of Week | |
| Discharge Level of Care | Assigned by revenue code by Clinical Analytics. |
| Admit Type | As received by Clinical Analytics. |
| Admission Source | |
| Discharge Disposition | |
| Expired | Defined by discharge disposition as received by Clinical Analytics. |
| 30 Day Readmission Forward | Calculated by Clinical Analytics. |
| Physicians | List of physicians coded on the case, including attending, operating (principal px), operating (principal or secondary px), other, anesthesiologist (principal or secondary px), consulting, admitting, referring, obstetrician, emergency department, discharging, and Axiom Attributed (if applicable) physicians. By clicking the question mark next to the physician name, you can mark an encounter as "Not My Patient" so this patient no longer shows up in the reports for this physician. |
| Nursing Units | Primary, Attending, and Discharging as received by Clinical Analytics. |
| Coders | List of coders as received by Clinical Analytics. |
| Related Records | Mother/ baby relationships as received by Clinical Analytics. |
DRG, Diagnosis, and Procedures
The DRG, Diagnosis, and Procedures tab shows all the diagnosis codes, procedure codes, and related DRGs.
| Row Name | Description |
|---|---|
| MS-DRG | Grouped by Clinical Analytics using the 3M grouper. |
| DRG Type | |
| APR-DRG | |
| Severity of Illness | |
| Risk of Mortality | |
| Principal Diagnosis | As received by Clinical Analytics. |
| Admitting Diagnosis | Text field as received by Clinical Analytics. |
| ICD9/10 Admitting | ICD diagnosis codes as received by Clinical Analytics. |
| Secondary Diagnoses | As received by Clinical Analytics. |
| Principal Procedure | |
| Secondary Procedures |
Clicking the Procedures grid shows the following columns with data (if available) displayed in the following order:
-
Procedure
-
Code
-
Description
-
Day of Stay
-
Date
-
Measure
-
Benchmark Value
-
Operating Physician ID
-
Operating Physician
-
Anesthesiologist ID
-
Anesthesiologist
If you click the PDF or Excel export icons, the data presented in the procedures grid displays in the same order on the PDF or Excel file.
Detail Services
This table shows all charges and cost (if applicable) associated with the stay. You can group the table by individual charges, by charge code, for all service dates, or a specific day.
| Column Name | Description |
|---|---|
| Revenue Code Category | Defined in Clinical Analytics Documentation: Revenue Code Categories |
| Revenue Code/Description | As received by Clinical Analytics |
| Charge Code/Description | |
| Date | |
| Ordering Physician | As received by Clinical Analytics– If nothing is listed, Unknown is displayed. |
| CPT/HCPCS Code/Description | As received by Clinical Analytics |
| Quantity | |
| Charge Amount | |
| Total Cost | As received by Clinical Analytics – linked value allows you to see total, fixed, variable, direct, indirect costs broken down. |
Utilization
The Utilization tab shows LOS and Charges sections comparing this encounter to the Benchmark Profile selected above the Clinical Case Summary tabs.
The graphics seen are defined as:
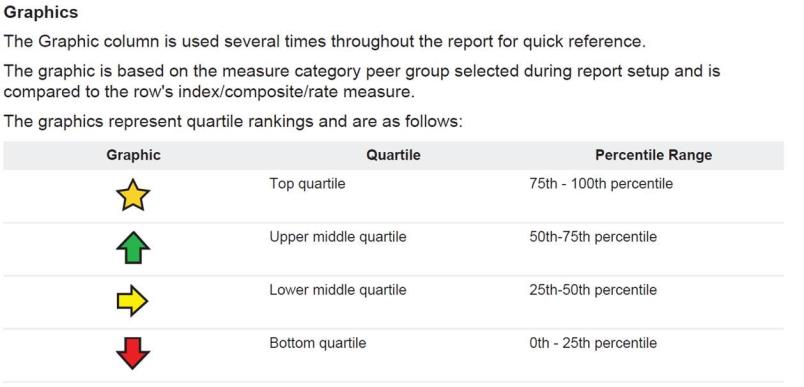
The LOS Analysis section measures aligns with measure you can add elsewhere in Clinical Analytics, as well as the different buckets in the Charges section.
Quality and Safety
Similar to the Utilization tab, the Quality and Safety tab shows measures available elsewhere in Clinical Analytics. Both sections have a color coded Value column, where cells with Yes are colored red to bring attention to them as potential areas of improvement. The Benchmark column of the Quality section shows the expected value for that particular measure. The Patient Safety section shows a selection of patient safety measures, which may change depending on the patient and if they had a patient safety incident.
Patient Satisfaction
If received by Clinical Analytics, this tab shows the different patient satisfaction measures with the responses and benchmark values for each response. The Value column is, again, color coded to bring attention to the potential areas of improvement. In addition to the individual questions directly from their survey, there are composite values created from groups of questions.
Physician Attribution
If applicable, Clinical Analytics can calculate an attributed physician based on ordering data and other components of each encounter. When there is sufficient data to assign an Axiom Attributed Physician, this tab appears in the Clinical Case Summary. For more information, contact Support about adding this functionality to your Clinical Analytics environment.
This tab shows the Axiom Attributed Physician, their information, and comments about how they were assigned to that patient. This assignment can be overridden for any patient if there is another physician who would be more correctly assigned to this role. In addition to the attributed physician, it shows the physician(s) who contributed in large part to the encounter, split up into a number of categories identified by Clinical Analytics.
