MS-DRGs vs. APR-DRGs
What's the difference and why does it matter?
You can download this as a PDF or you can check out MS-DRGs and APR-DRGs for more details.
History and Background
The first DRG (Diagnosis Related Group) system was developed at Yale University in the early 1970s. DRGs were developed to:
- Assess hospital lengths of stay
- Allow hospitals to compare resource allocation and perform cost-center analysis
- Predict the likely resource consumption for any given hospital stay
- Be specific enough that the variation among a DRG was predictable, but also general enough that most hospitals could make comparisons
Some Definitions
MS-DRG: Medicare Severity Diagnosis Related Group
APR-DRG: All Patients Refined Diagnosis Related Group
Case-Mix Complexity: The overall complexity of the population, or a subset of the population, of inpatients treated at a hospital
DRG: Diagnosis Related Group
MDC: Major Diagnostic Category (each MDC was designed to correspond to one major organ system)
Base DRGs correspond to different reasons for hospital admission. Generally, there is at least one base DRG for ungroupable or invalid data. Subclasses for each DRG refer to measures of complication (MS-DRG has CC/MCC and APR-DRG has SOI/ROM). Case-mix complexity at a hospital has different attributes that may be considered in an analysis, including: relative resource consumption, prognosis, treatment difficulty, SOI/ROM, need for intervention, and more. All of these attributes cannot necessarily be incorporated in one measure, so we use groupers and sub-classes to adjust for complexity.
Using DRGs in Clinical Analytics
In Clinical Analytics, you have the choice to adjust benchmark values by APR-DRG or MS-DRG.
In calculating Opportunity for various measures, you may notice an “expected value.” The expected value is the average value that would result if the hospital’s mix of patients by severity level had been treated at the average level in a reference data set. This is calculated by taking the average measure value for each base DRG subclass in a data set and multiplying the number of patients in the subclass.
About MS-DRGs
Non-CC: Non-Complication/Comorbidity; case complexity does not greatly affect resource use
CC: Complication/Comorbidity; encounter has moderate level of resource use
MCC: Major Complication/Comorbidity; reflects the highest level of resource use
How are MS-DRGs determined?
MS-DRG Grouper Inputs
- Diagnosis codes (principal and secondary)
NOTE: CMS truncates the list of diagnosis codes to report only 12.
- Procedure codes (principal and secondary)
- Patient gender & age
- Discharge status
What is unique about MS-DRGs?
Base MS-DRGs have subclasses (Non-CC, CC, MCC) to better characterize resource utilization. MS-DRGs are used exclusively by CMS for reimbursement.
When should I use MS-DRGs?
MS-DRGs should be used when:
- Solely analyzing Medicare population or reimbursement
- Comparing GM-LOS (Geometric Mean Length of Stay)
- Looking at Coding Analytics
NOTE: Some clients provide an MS-DRG on encounter records, so you may see an option between “MS-DRG” and “Client MS-DRG.” These values are typically the same, but may be different depending on the MS-DRG version your facility uses.
About APR-DRGs
SOI: Severity of Illness
ROM: Risk of Mortality
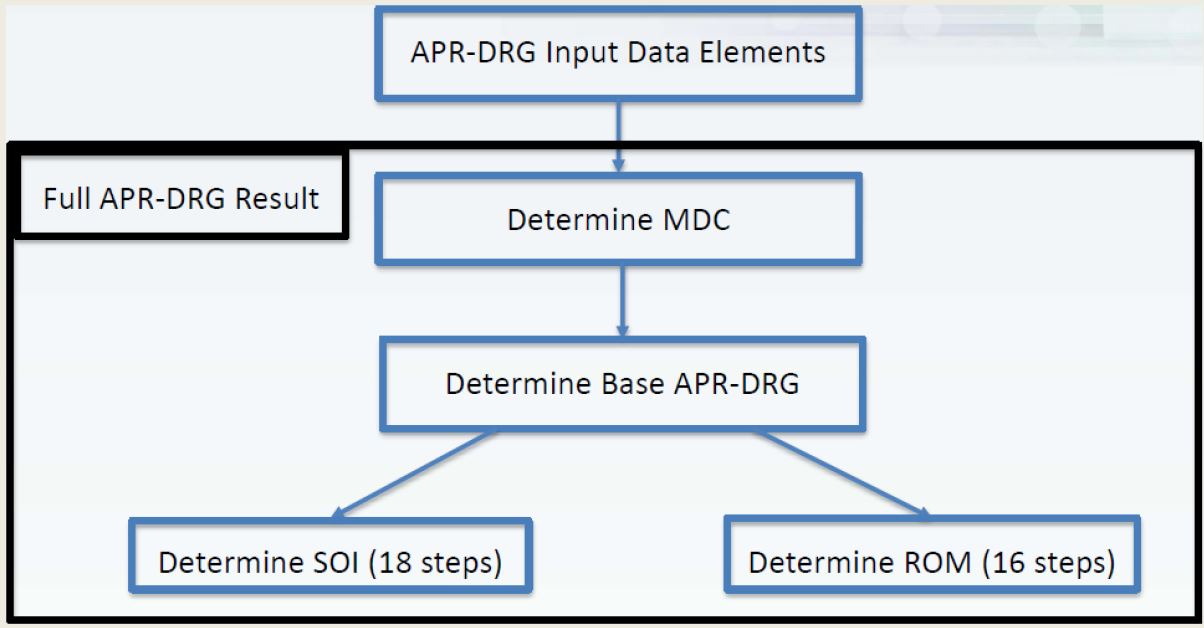
How are APR-DRGs determined?
Data for APR-DRG classification is taken from the UB claims form. APR-DRGs are based on clinical logic, not a mathematical model; the logic was then verified with data, so you can be confident that the grouper assignments accurate and make sense.
APR-DRG Grouper Inputs
- Diagnosis codes (principal and secondary)
- Clinical Analytics accepts up to 75 secondary diagnosis codes.
- Procedure codes (principal and secondary)
- Clinical Analytics accepts up to 75 secondary diagnosis codes.
- Patient gender & age
- Patient birthweight, if applicable
- Discharge status
Grouper steps
- Assign an MDC (Major Diagnostic Category)
- Assign a base APR-DRG based on clinical logic
- Assign an SOI (1-4)
- Assign an ROM (1-4)
About SOI and ROM
Each of the 314 base APR-DRGs have a separate clinical model for SOI & ROM, so we do not expect them to be the same value or use them interchangeably. Both are disease-specific, so an SOI of 3 for one DRG does not necessarily equate to the same level of illness as an SOI of 3 in another DRG. Thus, we do not recommend averaging SOI across DRGs.
| SOI | ROM |
|---|---|
|
|
It is important to recognize that, while similar, SOI and ROM are unique attributes of the patient encounter, so, while SOI quantifies the extent of the physiological decompensation (organ system loss of function) experienced by the patient, ROM quantifies the likelihood for the patient to expire. SOI is primarily designed to explain the relative complexity of a hospital’s patients; ROM can be used to adjust for and give information on mortality-related measures.
What is unique about APR-DRGs?
With APR-DRG, you can:
- Allow for mortality analysis by avoiding the use of death to define base DRGs
- Account for Severity of Illness and Risk of Mortality
- Recognize impact and interactions of secondary diagnoses
- Allow for reimbursement methodologies to account for SOI/ROM, rather than resource use only
- Allow for outcome comparisons in addition to resource use comparisons
- More completely describe all patients seen within an acute care hospital
- Access 47 neonatal-related DRGs not found in other systems
When should I use APR-DRGs?
APR-DRGs should be used in the following:
- Analysis of all patients (especially neonates and obstetrics)
- When comparing mortality measures
- When severity adjustment is required
- When risk adjustment is required (generally mortality)
- When non-Medicare reimbursement is being considered
- When all patients at a hospital need to be compared
Which one should I use for my analysis?
Clinical Analytics Software recommends using APR-DRG for the majority of your analyses:
- SOI and ROM exist for every base DRG
- APR-DRGs are more robust for mortality comparisons and risk-adjustment
- Weights are more significant in the APR-DRG system because it can be weighted at the SOI or ROM subclass level
- The high specificity of APR-DRGs make them ideal for analyzing readmission rates and other outcomes measures
- CMS’s truncation of the number of procedure and secondary diagnosis codes can have an effect on the grouper result
Use MS-DRGs for Medicare reimbursement purposes and when analyzing a Medicare population.
Questions?
Contact Clinical Analytics Support: peaksupport@syntellis.com or (847) 441-0022
