AX1530
By default, when an Axiom form is viewed, colors are automatically assigned to each series in a chart based on a set of colors defined in the style or skin (in that order). Alternatively, you can assign a color to each series in a chart, and the chart will render using those colors. This applies to the following charts: all charts in the XYChart family, all charts in the ScatterChart family, and Pie Charts. Other charts have different methods of specifying colors.
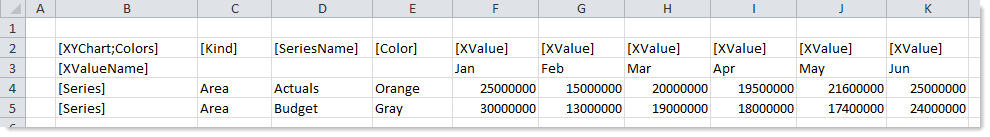
In the data source for the chart, add a [Color] tag to the control row, and then enter the desired color for each series. You can use basic color names (for example, Blue) or you can enter valid hexadecimal color codes (for example #00FFFF for Aqua).
The data source for the chart would appear as follows:
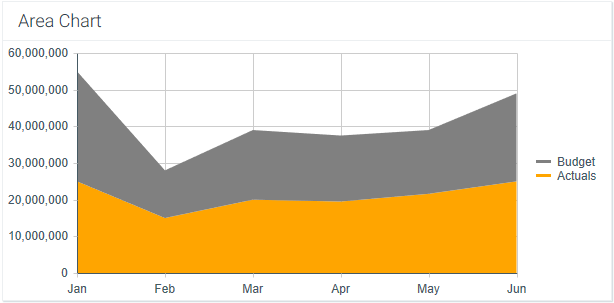
The resulting chart would appear as follows:
For Pie Chart components, the color is defined per [PieItem] instead of per [Series], but otherwise the color assignment works the same way.
Note the following design considerations for certain chart types:
- ScatterChart: Charts in the ScatterChart family can have multiple rows per series. In this case, the color assignment is handled as follows:
To use the same color for all items in the series, you can enter the same color on all rows of the series, or you can enter a color on only one row of the series (leaving all other rows in the series blank).
To use different colors on all items in the series, enter different colors on each row. This only applies to Bubble series and Scatter series. ScatterLine series can only use one color per line. If different colors are specified for the same ScatterLine series, the first color listed will be used.
- Waterfall: Waterfall charts support additional columns of
[RunningTotalColor]and[TotalColor], so that you can optionally specify different colors for columns showing computed totals.
