Compare actual and forecasted statistics
Use the Consolidated Income Statement and Key Metrics report before finalizing a forecast to spot and correct areas that need to be updated. This report is part of a series of executive summary reports that help you review, finalize, and improve the integrity of your forecasts.
What: This report compares statistics for the current actual period to the most recent forecast of the same period in an income statement format. Review individual or combined RFGroup income statements with key metrics calculated using a key driver or statistic within the report. Variance amounts and percent change columns are included for each comparison forecast period. You can drill down to view to RFCode detail for each summary section. You can configure statistics in the report from drivers and adjust data in plan files.
Where: This report is available from the Reporting section of the RF Admin and RF User task panes.
Who: All Axiom Rolling Forecasting users can access this report. The ability to select RFGroups depends on users’ permissions.
To use the report:
NOTE: To work with this report, verify that Rolling Forecasting actual data is loaded and forecast data exists for the periods used in the report.
-
In the task pane under Reporting, double-click Consolidated IS & Key Metrics.
-
In the Refresh Variables dialog, select the report criteria, and then click OK.
Refer to the following table for an explanation of options:
Field Description Select RFGroup Field to Filter By Select the group type for the source data. Select [group] (Leave blank for All) To pull data from all groups, leave the default (All), or select one or more specific groups. Select Period View Select to compare data by month or by quarter. Select # of Actual [periods] Select the number of months or quarters of past data (actuals) to include in the report. You can include up to 24 months of historical data. Select # of Forecast [periods] Select the number of months or quarters of future data (forecast) to include in the report. You can include up to 34 months of forecast data. You must select at least one month. Include CY Budget? Select to include data from the current year budget. Select Scenario Select the scenario to apply to the data pulled into the report. Include Approved Initiatives? Select to include data from approved initiatives.
NOTE: To include historical initiative data, ensure that historical initiatives included in this report are set to Approve for the historical periods used in this report. For information, see the help topic Update initiative status.
Select RFGroup Summation Level Select the group level at which to sum the reported data.  Top of report
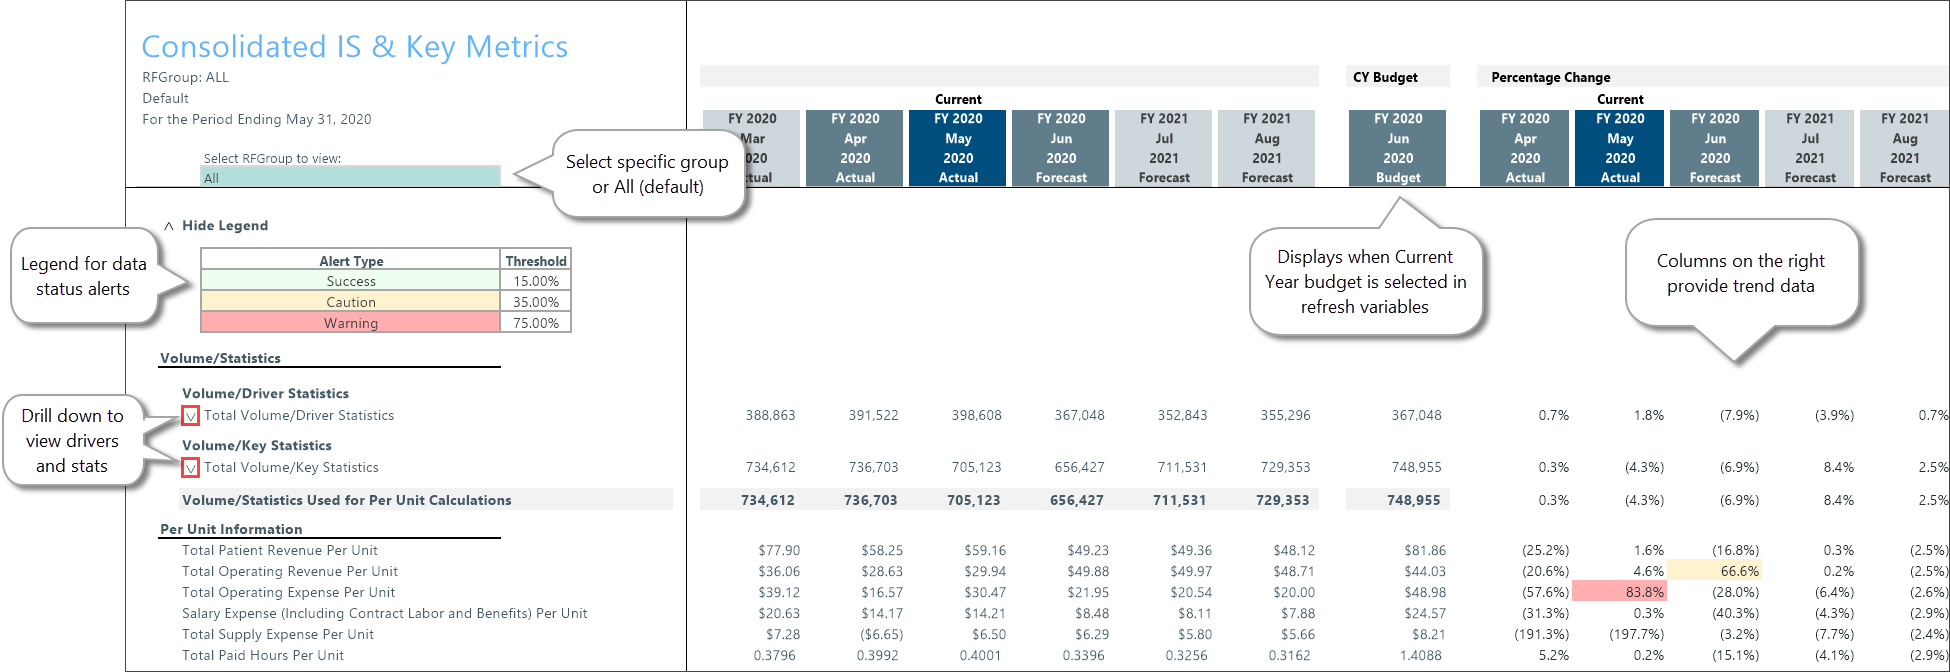
The top of the report displays the Volume/Statistics section followed by some per-unit totals. You can view data for all RFGroups or select a single group from the Select RFGroup to view drop-down.
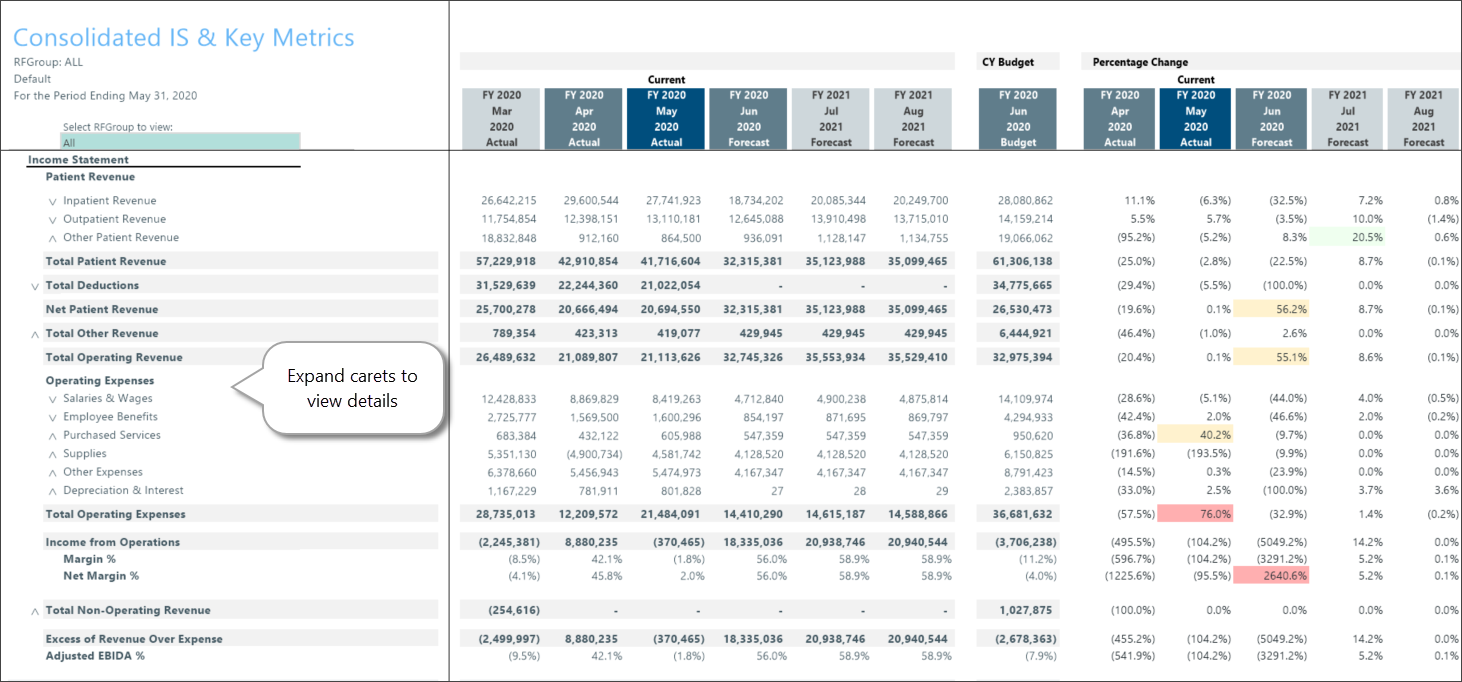
 Middle section
The middle of the report is the income statement section with the capability to drill down to details for each RFGroup.
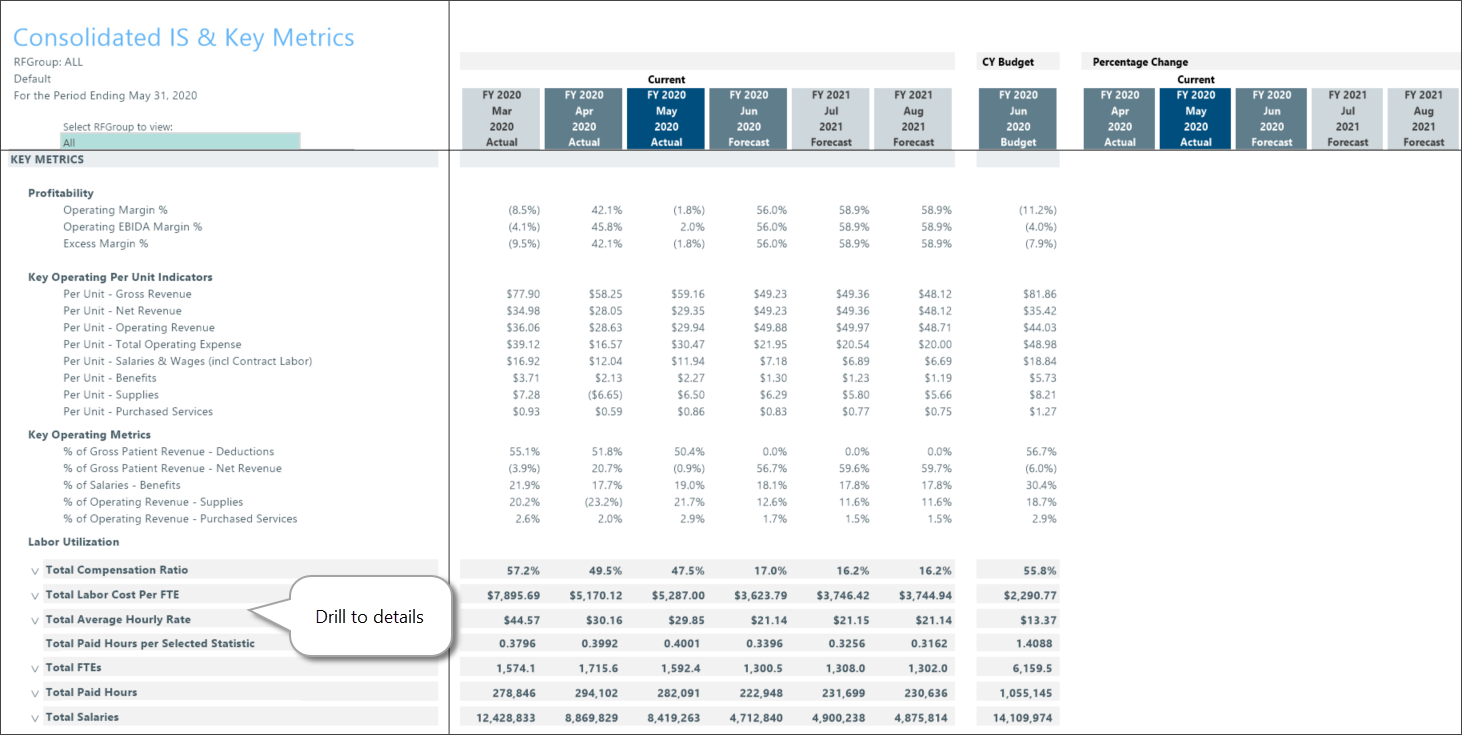
 Bottom section
At the bottom of the report is the Key Metrics section with detailed per-unit information and drillable labor utilization metrics.