AX1840
After a web report is opened, you may have access to a variety of features to view and explore the data in the report, including filtering, sorting, and drilling. Additionally, web reports may be configured with report parameters, which can be used to dynamically change the data shown in the report.
NOTE: The features described in this topic apply to web reports created in the Report Builder. Web reports created from template may have similar features, but do not work in exactly the same way. For more information about viewing and exploring data in a web report created from template, consult the product documentation for the product that provided the template.
Drilling data
If the web report has been configured to enable drilling, you can drill any data row in the report. Total rows, subtotal rows, and section header rows are not drillable.
To drill a data row
-
Hover your cursor over the far left column in the report so that a magnifying glass icon appears on the row.
The tooltip for the magnifying glass will be either "Drill" (if multiple drill paths are available) or "Drill to <path>" (if a single drill path is available). For example, the tooltip will say "Drill to Acct" if the Acct drill path is the only available drill path.
- Select the icon to drill the row.
If multiple drill paths are available, these paths appear in a menu when you select the icon. Click the drilling path that you want to view.
If a single drill path is available, that path is automatically used when you select the icon to drill.
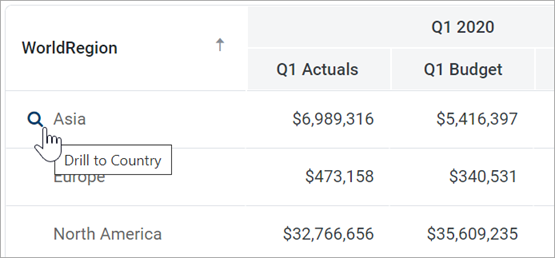
Hover and click to drill
The drill results appear within the current tab, replacing the original report. The current row being drilled and the current drill level display at the top of the drill results.
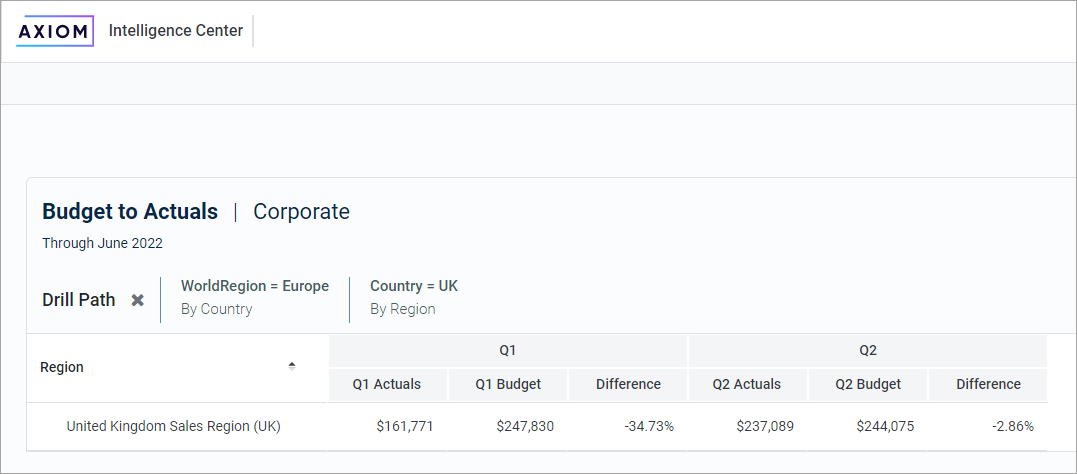
Example drill results with drilling path displayed at the top
You can continue drilling the drill results if additional drill paths are available. You can return to a previous path by selecting that path name in the header. When you are finished viewing the drill results, you can select the X icon in the drill path to clear the drill and return to the original report.
Using report parameters
If the web report is configured with report parameters, you can use the Report Parameters pane along the left-hand side of the report to dynamically change the data shown in the report.
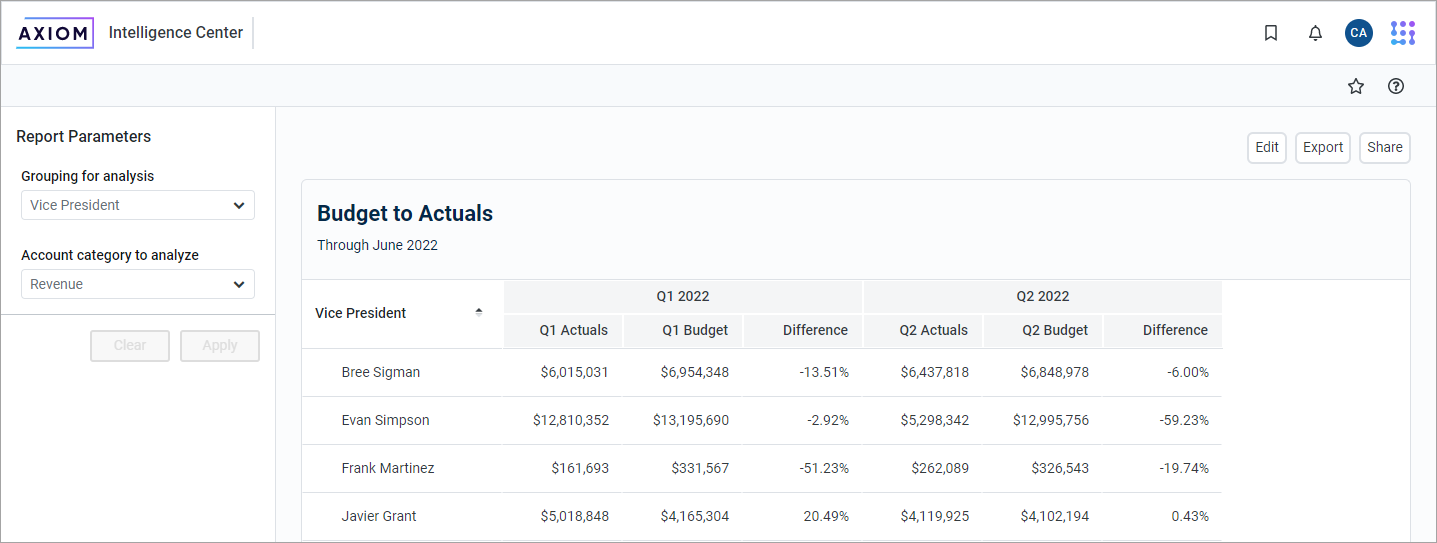
Example report with report parameters
The Report Parameters pane contains one or more parameters that you can set as needed. If the report requires you to select a parameter value in order to refresh data in the report, when you open the report the message "Waiting for input" appears in the report grid. Otherwise, the report opens, and refreshes data using default values defined for report parameters as needed.
You can interact with report parameters as follows:
-
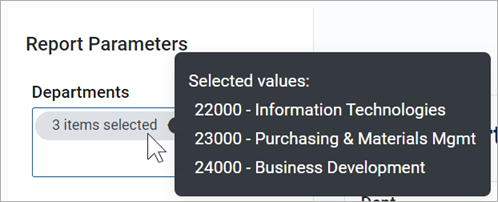
You can select one or multiple values for each parameter, depending on the parameter type and configuration. If a parameter allows multiple values to be selected, the parameter box shows text such as "3 items selected". You can hover your cursor over this text to view the selected values in a tooltip.
If the parameter allows selection of multiple values, and some values are already selected, then using the drop-down list to select more items will add to the current list of items. If you want to clear the list of items instead, and start over, select the X icon in the selection text.
-
A parameter may start out blank (unset), or it may start with a default value, depending on the parameter type and configuration.
-
Some parameters may be dependent on other parameters. In this case, the dependent parameter will not become available for use until its parent parameter has a selected value.
-
Parameters may be required or optional:
-
If a parameter is optional, then you can leave it unset, or you can clear its value selecting the X icon to the right of it.
-
If a parameter is required, then it cannot be cleared. You can select a different value, but you cannot fully clear the parameter. Exception: If the parameter allows selection of multiple values, then you can select the X icon in the selection text to clear the current selections.
-
After you have made selections for the parameters, you can apply and clear them as follows:
-
To refresh the report using your parameter selections, select Apply. The Apply button is not active until all required parameters have selected values.
-
To clear all optional parameters, select Clear. To refresh the report with the optional parameters unset, you can then select Apply.
NOTES:
-
When you share or export a report, it does not honor the report parameter selections, with one exception. If the report parameter determines the row dimensions of the report, and the parameter has a default value, the exported report will use that default value.
-
The specific parameters available and how they impact the report depends on the report configuration. If you have any questions about how the parameters affect the report data, contact your system administrator or the report designer.
Adjusting column width and order
You can make minor adjustments to the column display as follows:
-
To change the column width, hover your cursor along the right edge of the column header, then drag to make the column thinner or wider.
-
To reorder columns, select a column header, and then drag it to a new location. Note that columns cannot be moved in or out of a column group (meaning a set of columns grouped under header text). If a column belongs to a column group, you can change its order within the group but you cannot drag it out of the group.
Sorting data
If the web report uses a data grid with dynamic rows, then you can sort the data by any column in the grid. To sort the grid by a column, select the column header. Each click toggles between ascending sort, descending sort, and no sort. If the grid is currently sorted by a column, the sort direction is indicated by an arrow on the column header (up for ascending, down for descending).
The web report may only allow sorting by a single column, or it may allow sorting by multiple columns. This is configured by the report designer. If the grid uses single-column sorting, then it is not possible to clear the sort on a column. Instead, you must select a different column to change the sort to use that column.
If the web report uses a fixed row structure, then the row values are fixed in position and cannot be sorted.
Filtering by column data
If the web report uses a data grid with dynamic rows, you may be able to filter the report by the column data. For example, you might want to filter a column to hide zero-value records, or to show all records above or below a certain value. You might want to filter a dimension column to hide or show certain dimensions (such as departments, accounts, and so on). The report designer determines whether a column is enabled for filtering.
If a column allows filtering, the filter icon appears in the column header when you hover your cursor over the column header.
![]()
Filter icon for a column with filtering enabled
To filter the report based on a column
- To show the filter options, select the filter icon in the column header.
-
Set the filter options, as desired. The options vary depending on the column type.
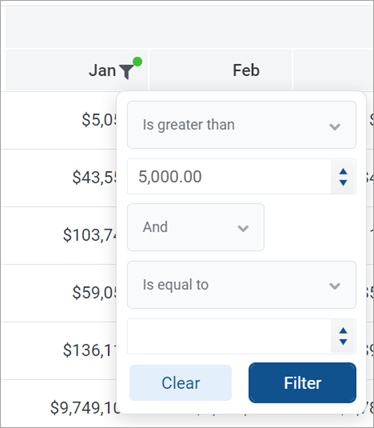
Example filtering options
- Select Filter.
The report updates to only show records that meet the filter. Additionally, the filter icon in the column header remains visible to indicate that the grid is filtered by this column.
The filter is retained until you clear it, or until the report is refreshed with new data.
To clear a filter
- To show the filter options, select the filter icon in the column header.
- Select Clear.
The grid updates to clear the filter. The filter icon is now only visible when hovering over the column header.
Viewing paged data
If the web report uses dynamic rows, the data is paged to show a specified number of records per page. If the data in the grid exceeds the page limit, you can move between pages using the page controls at the bottom left of the grid.
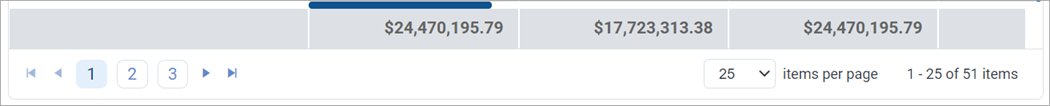
Page controls for data grids
- To move directly to that page, select a page number.
- To move one page back or forward, select the single arrow buttons.
- To move to the first page or the last page, select the double arrow buttons.
By default, the data grid shows 25 records per page. You can use the drop-down list next to the page controls to change this to 50, 100, or 500, as needed.