Configure users for report access
Before users can access dashboard reports, they must be set up in the Axiom as an EDS Dashboard user along with configuring the data they have access to.
To configure security for report access:
-
In the Axiom Enterprise Decision Support home page, in the Administration section, click Configure security.
-
Search for user by name, and click the name to highlight it.
-
On the right side of the page, click + Add User to Global Role.
-
Select one of the following roles types, and click OK:
-
EDS Dashboard Security Admin - Assign to users to allow them to configure and manage user security to access dashboards and report data.
-
EDS Dashboard User - Assign to all users to allow them access to dashboard reports.
NOTE: All users must be assigned this role - even if they are assigned the security admin role mentioned above.
-
-
Click the Quick Launch icon
 in the Global Navigation Bar, and click Windows Client or Excel Client.
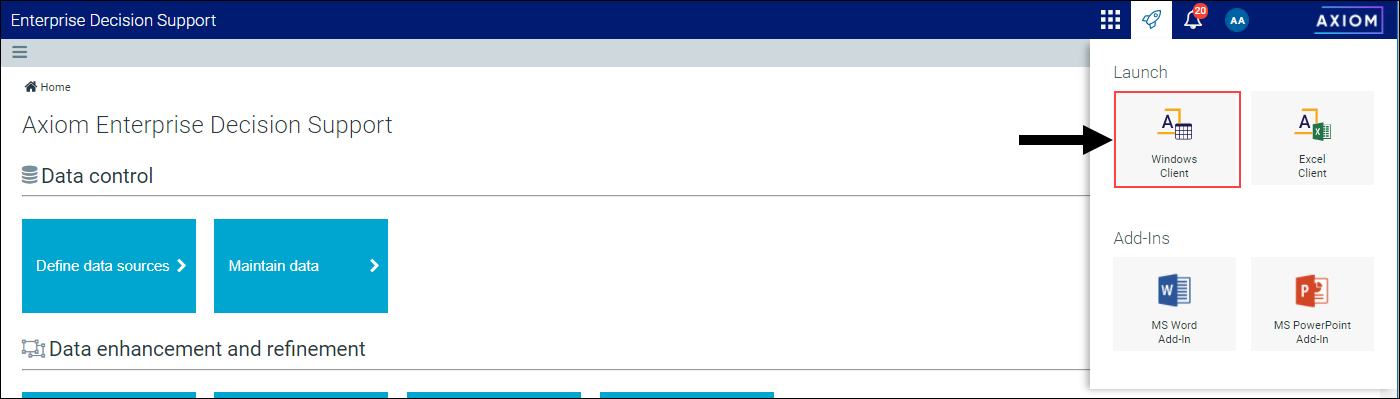
-
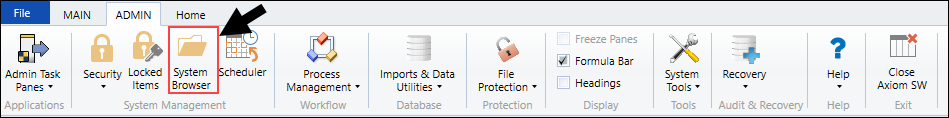
On the Main ribbon tab, click System Browser.
-
In the Libraries > Reports Library > Enterprise Decision Support > Standard Dashboards folder, double-click EDS Dashboard Data Security Utility.
-
On the Principals tab, complete the following columns:
Column Description Login Name Enter the login name for the user in which to give access to dashboard reports. Allow Full Access? Do one of the following:
-
To give the user full access to the data for all entities, select TRUE.
-
To limit the entity data that the user can view, select FALSE. In the Filter column, enter filter criteria used to specify one or more entities. For instructions on writing filters, see Filter criteria syntax
-
-
On the Roles tab, complete the following columns:
Column Description Role Name Type EDS Dashboard User. Table Name Select ServiceLineAssignment. Allow Full Access? Do one of the following:
-
To give the user full access to all service lines, select TRUE.
-
To limit the service line data that the user can view, select FALSE. In the Filter column, enter filter criteria used to specify the service line(s). For instructions on writing filters, see Filter criteria syntax
-
-
In the System Browser, click the Scheduler Jobs Library > EDS > Standard Dashboards folder, and double-click Refresh EDS Semantic Domains.
-
In the Scheduler dialog, in the Job ribbon tab, click Run Once.
After the Scheduler job processes successfully, the user can access the dashboards in the Enterprise Decision Support > Standard Dashboards folder of the Report Center.