AX1553
Reporting on time in step for a plan file process
Using the Time-in-Step page of the Web Client, process administrators can report on the average time plan files spent in each step. This report can assist in identifying bottlenecks in the process. Only administrators and process owners can access this report.
To access this page, use the following URL:
<baseURLtoAxiom>/process/processID/metrics
For example, if the process ID is 5988, the URL would look as follows:
https://ClientName.axiom.cloud/process/5988/metrics
In most cases, the URL will be already generated for you and included on your home page or other landing page for process administrators, so that you can simply click a link to be taken to the page. There is no way to look up the process ID for a particular process from the Web Client; this must be done in the Desktop Client General term for using either the Excel Client or the Windows Client, both of which are installed to the user's desktop. using either Axiom Explorer or the GetProcessID function.
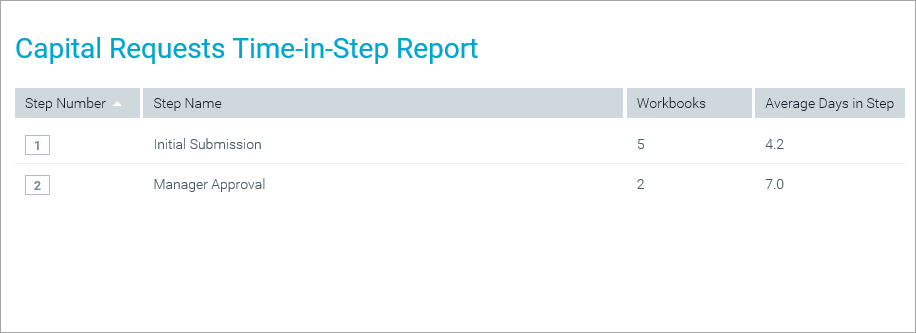
Example Time-in-Step Report
By default, this page shows the average total time plan files spent in each step. The calculation includes any plan file that has spent any time in the step, including plan files still active in the step, plan files that have completed the step, and plan files that were active in the step but were aborted out of the step (such as due to moving the plan file to a different step).
If a step is reopened for a particular plan file (such as due to a plan file being rejected back to the step), the time in step is not restarted for that plan file. Instead, the original time in step and the reopened time in step are added together to arrive at the total time in step.
Filtering the Time-in-Step report
If the time-in-step report for this process has been set up with refresh variables, you can use these variables to filter the results. Click the Filter icon in the toolbar to open the Filters panel and select values for the variables. When you click Apply, your selections will be used to filter the report.
For example, imagine that the process is for capital requests, and the Filters panel contains a refresh variable to select a request type. If you select Type 1 and click Apply, the report will be filtered to show the total average time in step for plan files that are classified as Type 1. The current filter will be shown at the top of the report, underneath the header.
The ability to filter the report and the specific filters available are determined at the process definition level. If the Filter icon is not present, then no refresh variables have been defined for the current process. Only the total average time-in-step can be shown.
For more information on how to set up a process definition to allow filtering the time-in-step report, see Configuring process web pages for plan file processes.
