AX1674
Managing visualization reports
You can create visualization reports to perform ad-hoc analysis and explore Axiom data using interactive data visualization tools.
In order to create a visualization report, you must have read/write access to at least one folder in the Reports Library, as defined in Axiom security. Also, if you have access to My Documents, you can create and save visualization reports there.
You can start the report creation process from either the Web Client or the Desktop Client. However, all visualization report creation and editing activity takes place in the Web Client. If you initiate report creation from the Desktop Client, you are automatically taken to the Web Client.
NOTE: Visualization reporting is a cloud-based feature that is only available in Axiom Cloud systems. Visualization reports rely on an engineered data model and specifically licensed features, which are only available in conjunction with certain Axiom products. If you currently license Axiom industry-specific products, please review your product documentation for details regarding the availability of visualization reporting. Alternatively, if you would like to independently use Microsoft PowerBI to query your existing Axiom data set, please refer to this articlethis article to instruct your information technology professionals to establish an OData connection.
Creating visualization reports
In the Web Client, you can create new visualization reports using the Intelligence Center.
To create a visualization report in the Web Client:
-
Click the Syntellis icon
 in the Navigation bar. From the Area menu, select Intelligence Center.
-
In the Intelligence Center, click Create > Create new visualization.
-
Depending on the visualization models available in your system, you may be prompted to select a model. Select the model that you want to use in this report, and then click Create.
Once a model has been selected, the new report opens in a new browser tab, within the visualization report editor. If only a single model is available to you, then that model is selected by default and the new report opens directly without the model selection prompt.
NOTE: The models available to you depend on the products you have installed and the type of models used by those products. Some models are only used by product-delivered dashboards and cannot be selected for use in new reports. Other models may be used in ad hoc reports as needed. Consult your product documentation for more information on the models available to you.
-
Using the report editor, add visualizations to the report and configure them to show the desired data. For more information, see Using the visualization report editor.
-
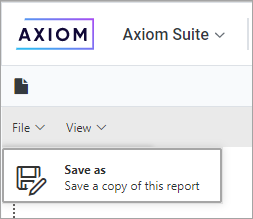
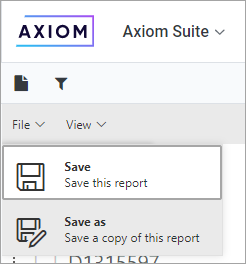
In the left-hand side of the report editor toolbar, click File > Save As.
-
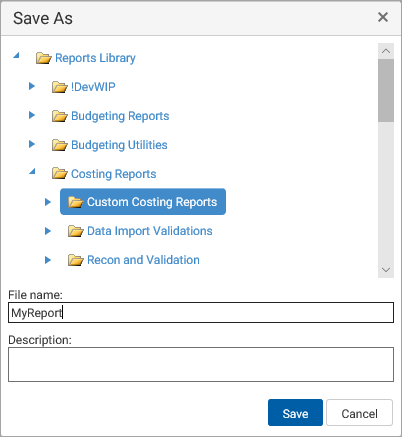
In the Save As dialog, select the folder where you want to save the report, then enter the File name and optional Description. Click Save to save the report to the specified location.
Creating visualization reports from the Desktop Client
In the Desktop Client (Excel Client or Windows Client), you can access the Intelligence Center from the Reports menu.
To create a visualization report in the Desktop Client:
-
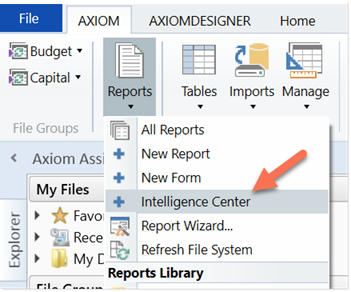
On the Axiom tab, in the Reports group, select Reports > Intelligence Center.
NOTE: In systems with installed products, this feature may be present on a different ribbon tab, such as the Main tab.
The Intelligence Center opens in the Web Client browser. From this point, all creation activities take place in the Web Client, and the steps are the same as described in the previous section.
You can edit existing visualization reports as needed, as long as the report was not installed by a product package. You must have read/write access to the report file in order to edit it, as defined in Axiom security.
Visualization reports can only be edited in the Web Client. Although you can open existing visualization reports from within the Desktop Client, you cannot edit them in that client. Once the report is open, all editing activities take place in the Web Client.
Only one user at a time can open a visualization report for editing. If another user attempts to edit the report while it is locked to another user, then it can only be opened as read-only. When a report is opened as read-only in the editor, no changes can be saved, but Save As can be used to save a copy of the file. Although the report is locked for editing, other users can continue to view the report as normal.
To edit a visualization report:
-
In the Intelligence Center, locate the visualization report that you want to edit. You can use folder navigation to find the report, or use the Search box at the top of the page.
-
Once the visualization report displays in the Intelligence Center grid, hover your cursor over the Name column to make the three-dots icon appear, then click the icon and select Edit.
The visualization report opens in a new browser tab, in the visualization report editor.
NOTE: If the Edit action is present but disabled, then you cannot edit this report. This is likely because you do not have read/write access to the report.
TIP: Alternatively, you can open the report from either the Intelligence Center or the Desktop Client, and then click the Edit icon in the right side of the gray toolbar to enter the editor.
-
Using the report editor, make changes to the report as desired. For more information, see Using the visualization report editor.
-
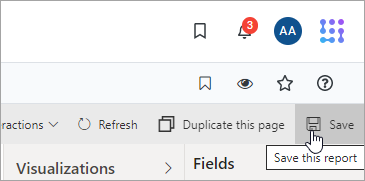
In the right-hand side of the report editor toolbar, click Save to save your changes.
You can also click the Go to Preview Mode icon
 at any time to view and interact with the report as end users will see it. The report is automatically saved before you enter preview mode. To return to the report editor from preview mode, click the Go to Edit Mode icon again.
If you want to save a new copy of the report instead of modifying the existing report, you can use File > Save As in the left-hand side of the report editor toolbar. If you have opened the report as read-only, then Save As is the only option.
If you are already viewing a visualization report, you can open edit mode directly instead of returning to the Intelligence Center. In the right-hand side of the task bar, click the Go to Edit Mode icon ![]() .
.
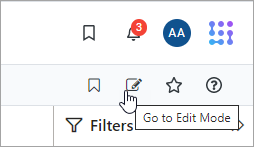
The report opens in the report editor, within the current browser tab.
Editing product-controlled visualization reports
If a visualization report was installed by a product, then that report is product-controlled and cannot be edited by clients. However, you may be able to save a copy of it that you can edit as needed.
-
Some product-controlled visualization reports are configured to not allow client edits. This is intended as a security measure for reports that use certain types of models. These reports cannot be used as a starting point to create a new report.
-
If a product-controlled report is not configured to disallow edits, then you can open it in the report editor for purposes of using Save As to save a copy of it. This option is only available if you have read/write access to the report. Once you have saved a copy of the report with a new name, you can edit that copy as needed.
Deleting visualization reports
You can delete a visualization report if it is no longer needed, as long as the report was not installed by a product package. You must have read/write access to the report and its folder in order to delete a report. Product-controlled visualization reports cannot be deleted.
Reports can be deleted from the Intelligence Center in the Axiom Web Client, or from Axiom Explorer in the Axiom Desktop Client.
TIP: If a report is deleted in error, an administrator may be able to restore the report using the Restore Deleted Files feature in the Axiom Desktop Client.
To delete a visualization report using the Intelligence Center:
- In the Intelligence Center, locate the report that you want to delete. You can use folder navigation to find the report, or use the Search box at the top of the page.
-
Hover your cursor over the Name column to make the three-dots icon appear, then click the icon and select Delete.
If the report cannot be deleted, the Delete action is disabled. This may occur because you do not have the necessary permissions to delete the report, or because the report belongs to an installed product.
-
When you are prompted to confirm that you want to delete the report, click OK.
To delete a visualization report using Axiom Explorer:
-
Launch the Desktop Client.
-
Launch the Desktop Client.
-
On the Axiom tab, in the Administration group, click Manage > Axiom Explorer.
NOTE: If your system uses installed Axiom products, you can access this feature from the Admin tab. Click System Browser to open Axiom Explorer.
TIP: You can also use the Explorer task pane to delete a visualization report.
-
Navigate to the Reports Library, and then locate the report that you want to delete.
-
Right-click the report and then select Delete.
-
When you are prompted to confirm that you want to delete the report, click Yes.
