AX1816
New features and enhancements
This section provides an overview of the features and enhancements in this release.
Filter enhancements
Add limit filter support in column value report parameter
You can use the new limit filter to broaden your ability to view data from any table in your organization. This powerful new filter lets you generate data sets in a single filter that wasn't possible before.
Axiom has two types of tables:
-
Data tables contain transactional or budget data, such general ledger or budget tables.
-
Reference tables (also called lookup or dimension tables) are single-key tables with values that point to other values.
An example of a reference table is the DEPT table, which contains keys for department-related data, such as department name, department description, and locations, such as WorldRegion and Country. Data tables contain data that is linked to a key.
A key in a dimension table can point to many data tables.
When you create a report, the tables you can use in the report are listed on the left side:
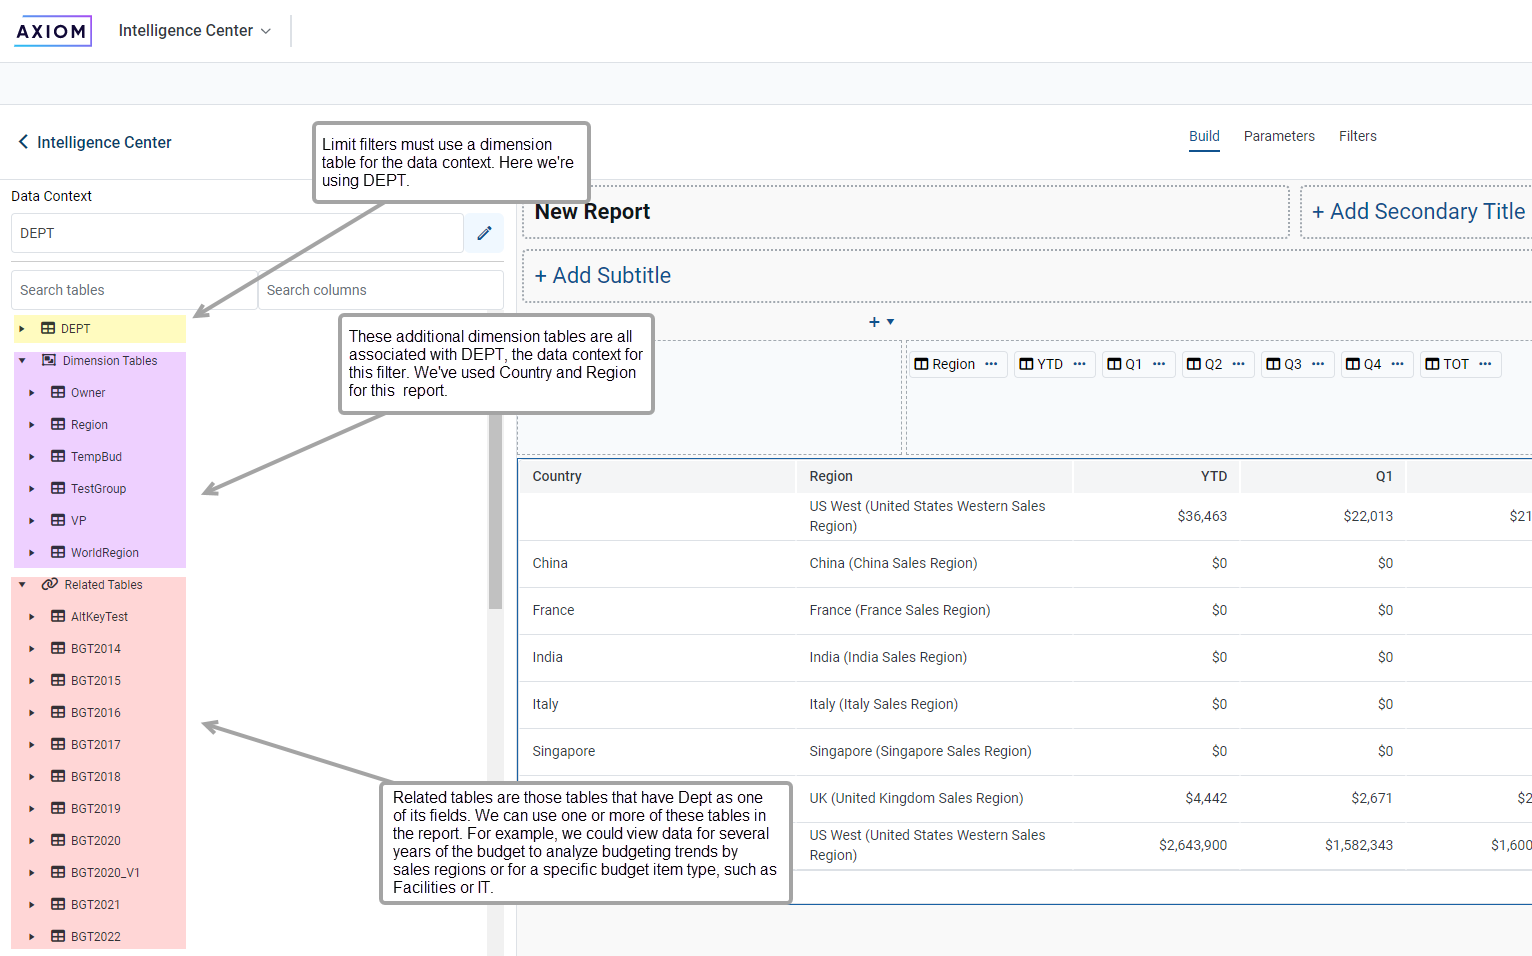
Annotated view of tables
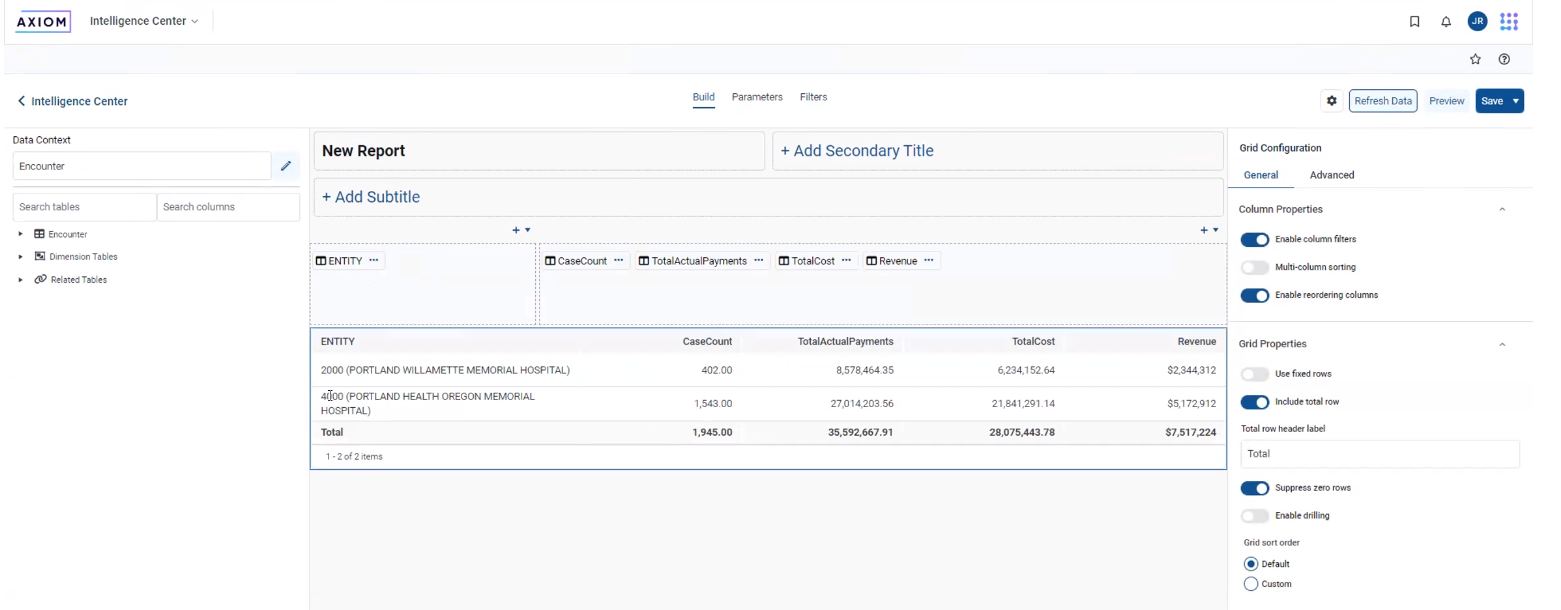
You can create a report based on the Encounter table, but without any filters.
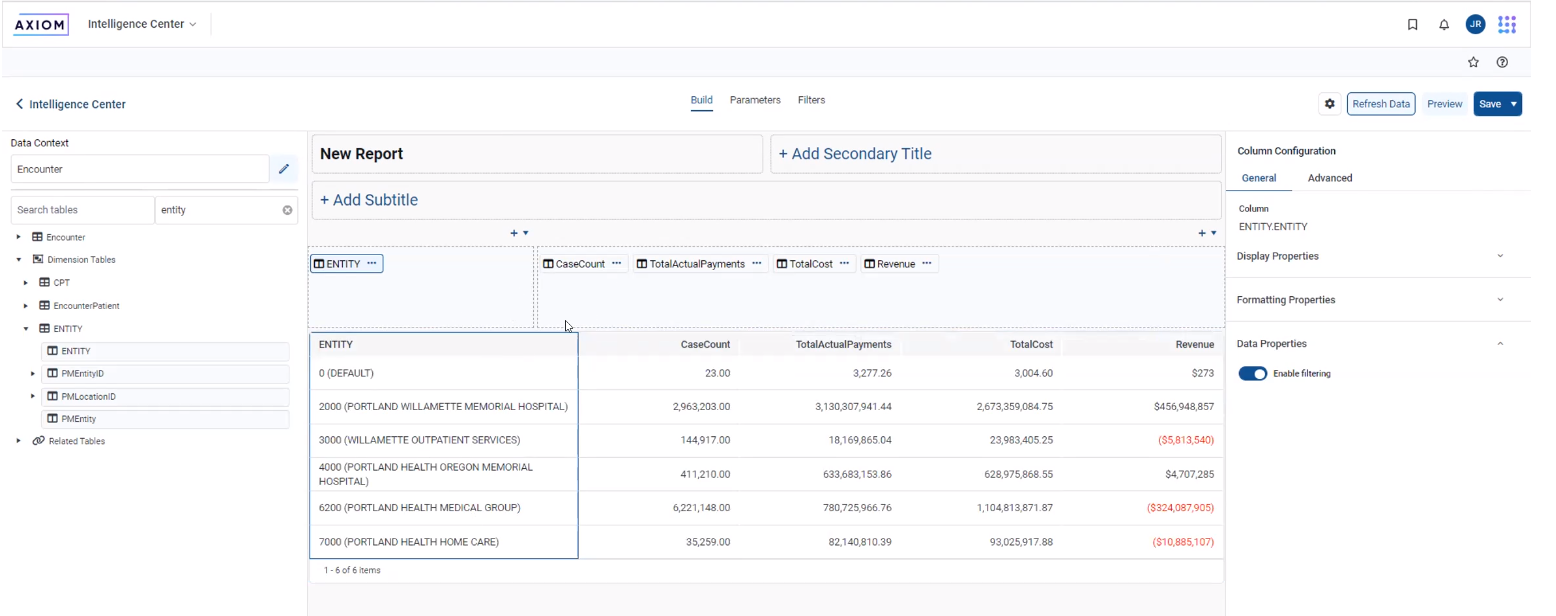
Report without filters
For this report, you can view information about a specific population group, such as patients who have had a total hip replacement.
For a limit report, select the General Filter option, which lets you limit data from any table.
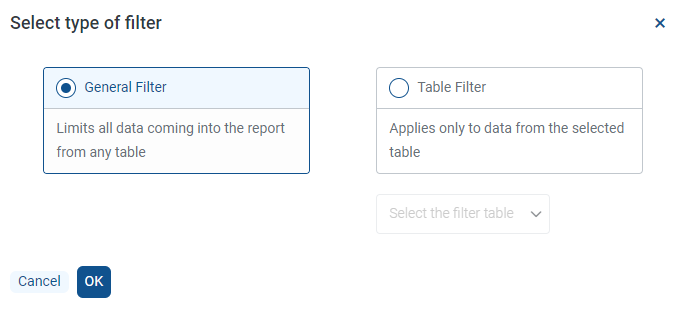
Filter selection dialog
Here we define the population group of patients who've had total hip replacements:
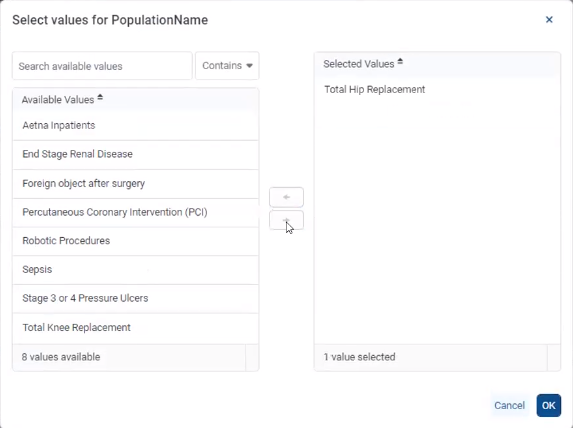
Selecting value for PopulationName
After you finish creating the filter, review how the results have changed:
Completed limit filter report
The previous example uses a simple limit filter; however, filters can be as complex and detailed required.
Notes to remember about filters:
-
You cannot directly edit the SQL statement; instead use the filter and selection tools.
-
Make sure the data context for your report is a dimension table. If you use data table as context, the report can only contain data from that data table.
-
Always use the General Filter option when creating a limit filter.
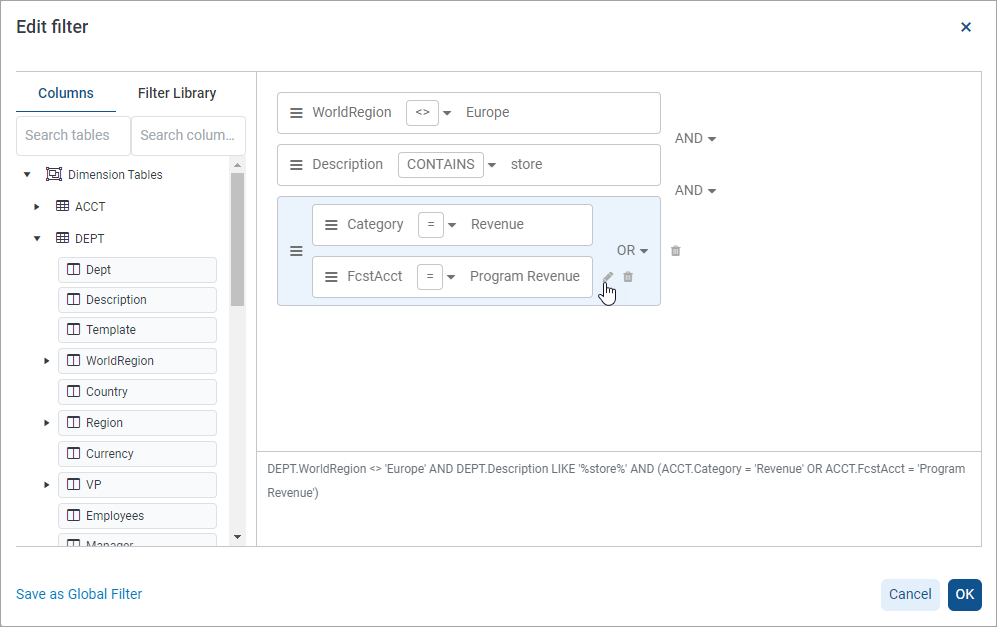
Improved filter creation experience
This feature changes how user create filters on the Filters tab of the Report Builder. Previously, users clicked the Add button with a drop-down menu to select General or Table-Specific to open the Filter Wizard.
Now the Add button opens an intermediary dialog. The dialog presents the General/Table-Specific choice with some explanatory text to help guide the selection. After selecting an option and clicking OK, you're presented with the Filter Wizard to create the filter.
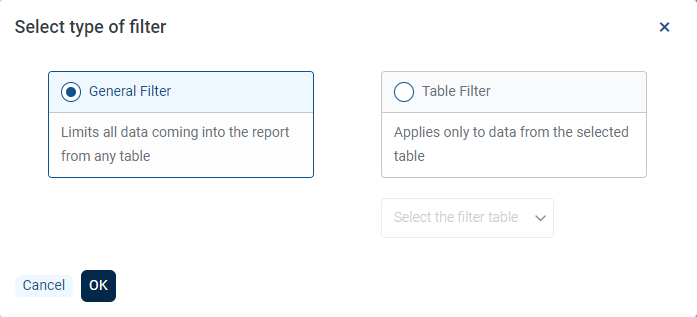
Create filter popup windows
Added support for manual entry when using filter wizard
You can now enter data manually when creating a wizard in addition to using the values included in the wizard. Manual entry includes typing values yourself or pasting from another source.
In this example, two departments were entered with a comma to separate the values. You can view the resulting SQL statement in the bottom pane of the page:
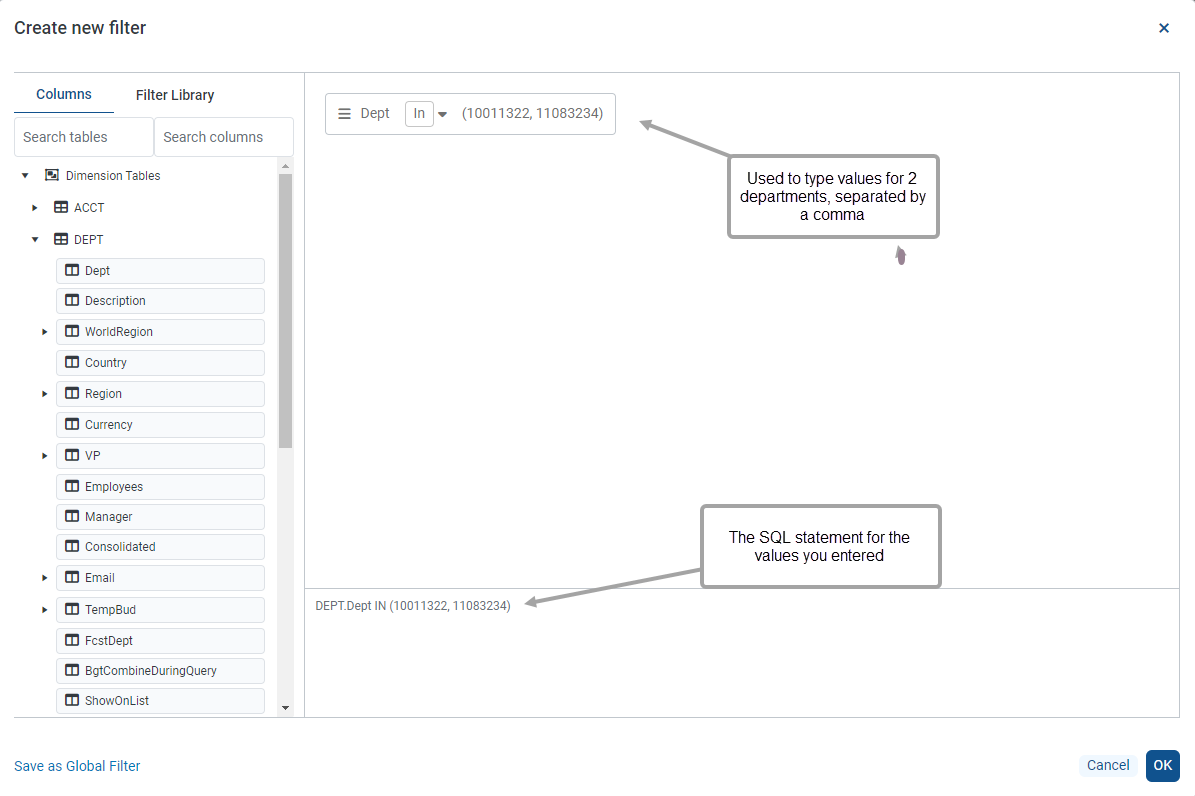
Filter wizard with manually entered numbers
You can paste values from other sources, such as spreadsheets. For pasted content, the filter wizard will recognize most filter delimiters (such as spaces and semi-colons) and correctly create the SQL statement. However, if you are typing values manually, use commas.
When you enter simple string values, you do not have to place the quotes around the string because they are added automatically. In this example, the string contains several countries (France, Italy, US, UK) without quotes. In the case of Costa Rica, you must add quotes because that country has two words.
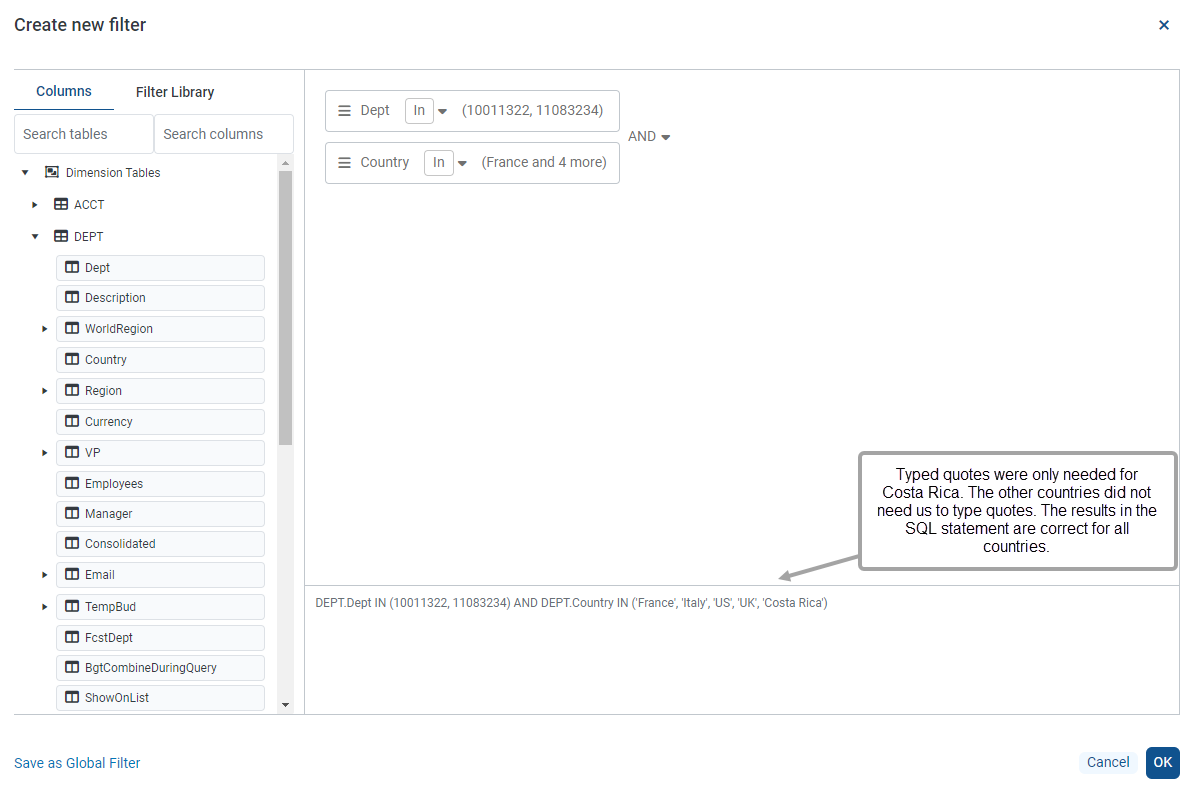
Filter wizard with manually entered strings
Notes about manual entries:
-
If your string has leading or trailing spaces, use quotes that include those spaces (for example, ' a ').
-
If you search for a value in a large table (such as the Encounter table), you can type the first few characters or numbers in the search field to retrieve those results more quickly.
-
You cannot directly edit the SQL statement for your filter. If you need to make changes or additions, use the filter options to select or manually enter the values needed.
Added support for isNull and isEmpty
The filter wizard now supports the use of Is Null/Is Not Null (for numeric values) and Is Empty/Is Not Empty (for strings). In this example, we used Is Empty for Email to see which people did not have an email address and Is Null for DEPT_DATE to see where date records using the FULL year option are not present.
![]()
Filter showing IsEmpty and IsNull
Report Builder enhancements
Pre-aggregation calculations
You can pre-aggregate calculations in a calculated column. A pre-aggregate calculation is applied to data rows in the query before those rows are aggregated by the row dimension.
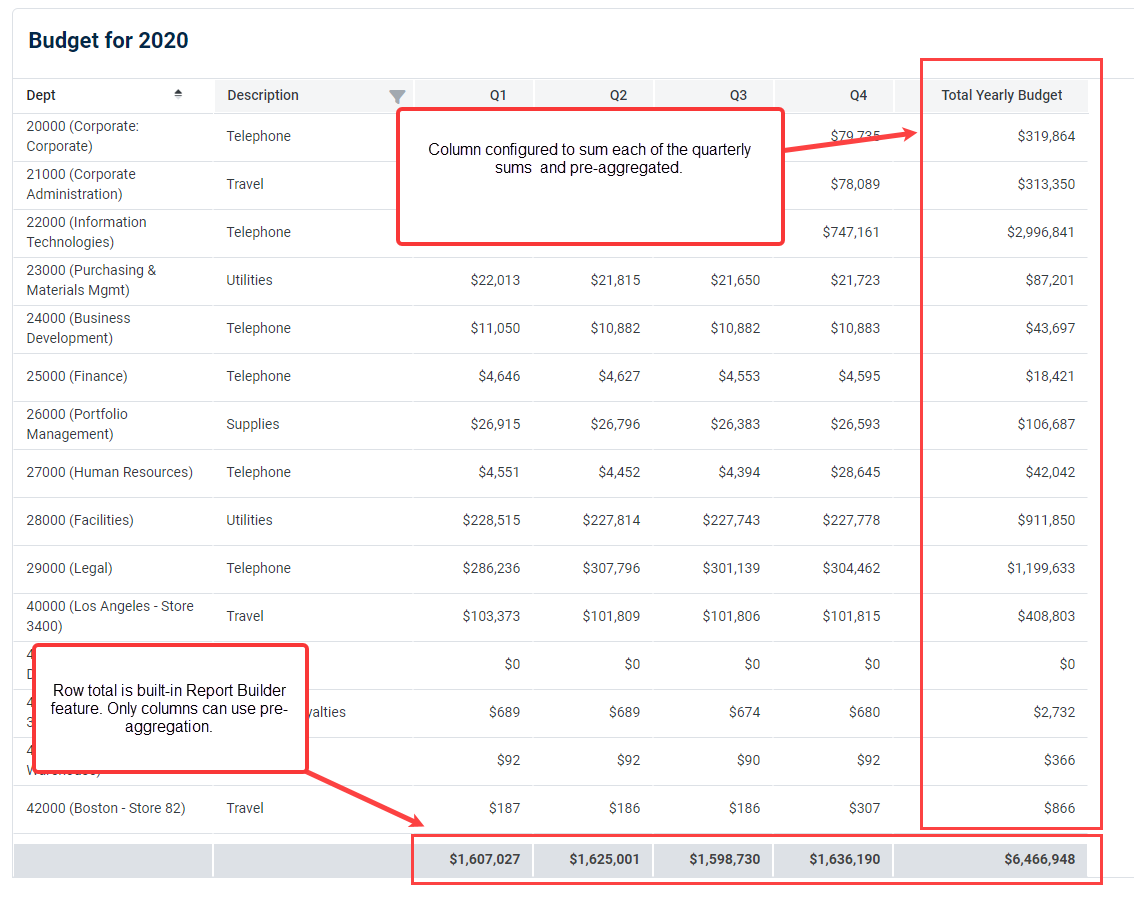
Example of report with pre-aggregated columns
Review the options for configuring this column.
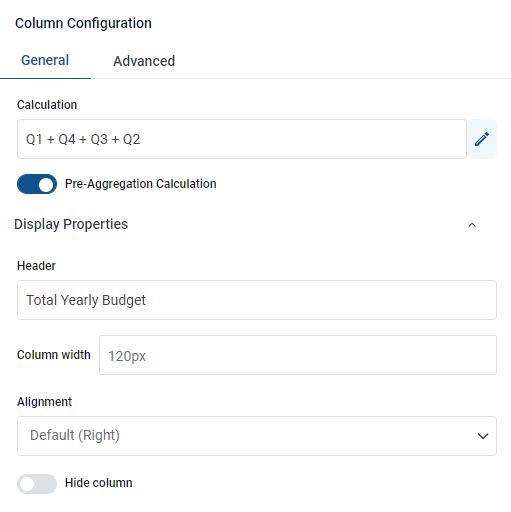
Configuring column with a pre-aggregated calculation
In this example, the calculation adds the values Q1 through Q4, though complex calculations are supported. Click the pencil icon to open the Edit Calculated Column dialog box to enter your calculation.
Next, click the Pre-Aggregation Calculation button.
The last section lets you define data properties for the column:
NOTE: Pre-aggregation calculations can only use columns on the primary table or a lookup table. There are no controls/validations in the UI to enforce this — if your calculation is invalid you will get a runtime error when refreshing the report.
NOTE: Pre-aggregation calculations cannot reference post-aggregation calculations but they can reference valid pre-aggregation calculations.
Use of pre-aggregation calculations impacts the total row, if it is enabled. Behavior is as follows:
-
Post-aggregation calculations: The calculation is performed on the total row values of the source columns.
-
Pre-aggregation calculations: The values in the calculated column are summed for presentation on the total row.
-
Pre-aggregation calculations can use alternate aggregations if desired. The field is unhidden for the calculated column when pre-aggregation is enabled. If an alternate aggregation is set and then pre-aggregation is disabled, the alternate aggregation field is re-hidden and ignored.
DatePart support for ColumnValue and ColumnList report parameters
You can now use date parts with ColumnValue and Column List parameters.
ColumnValue
Start with a report where you want to use a date part.
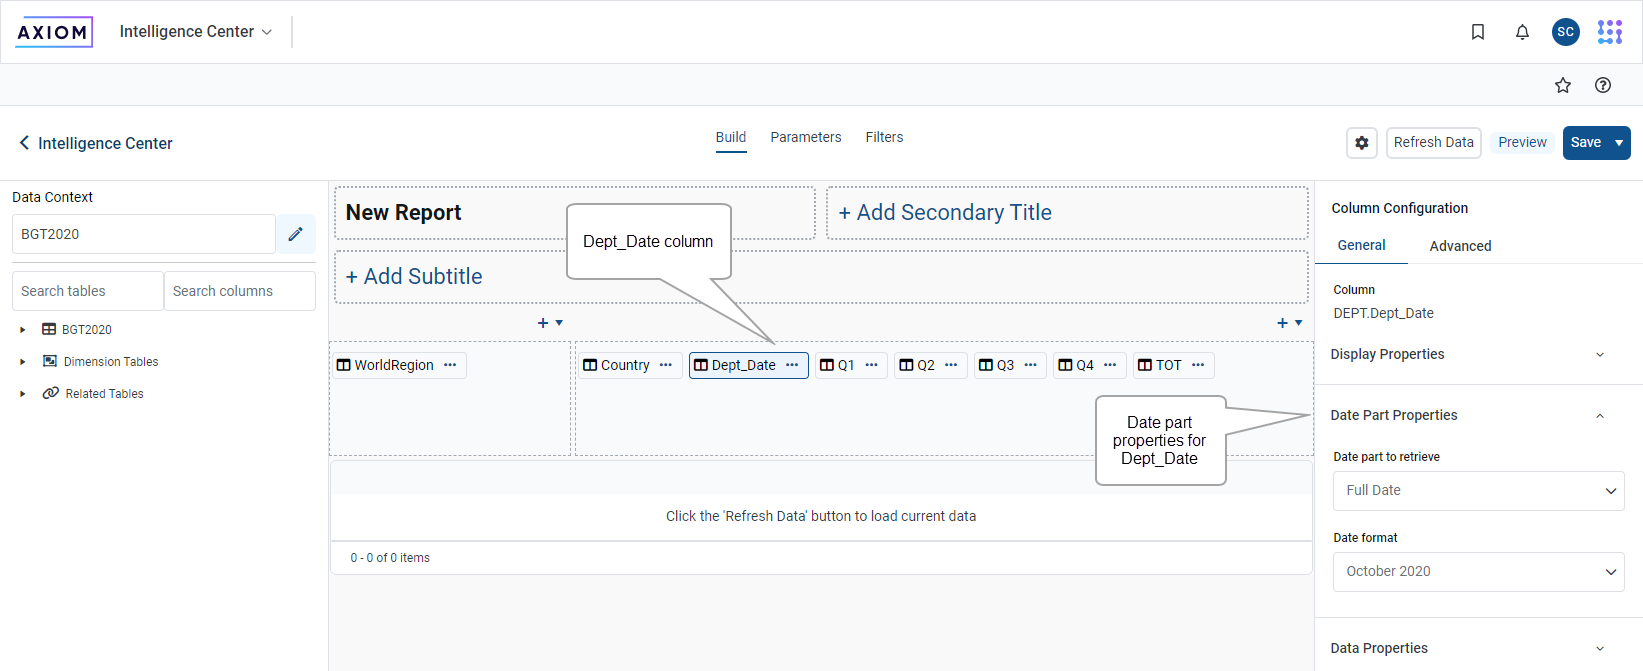
Sample report
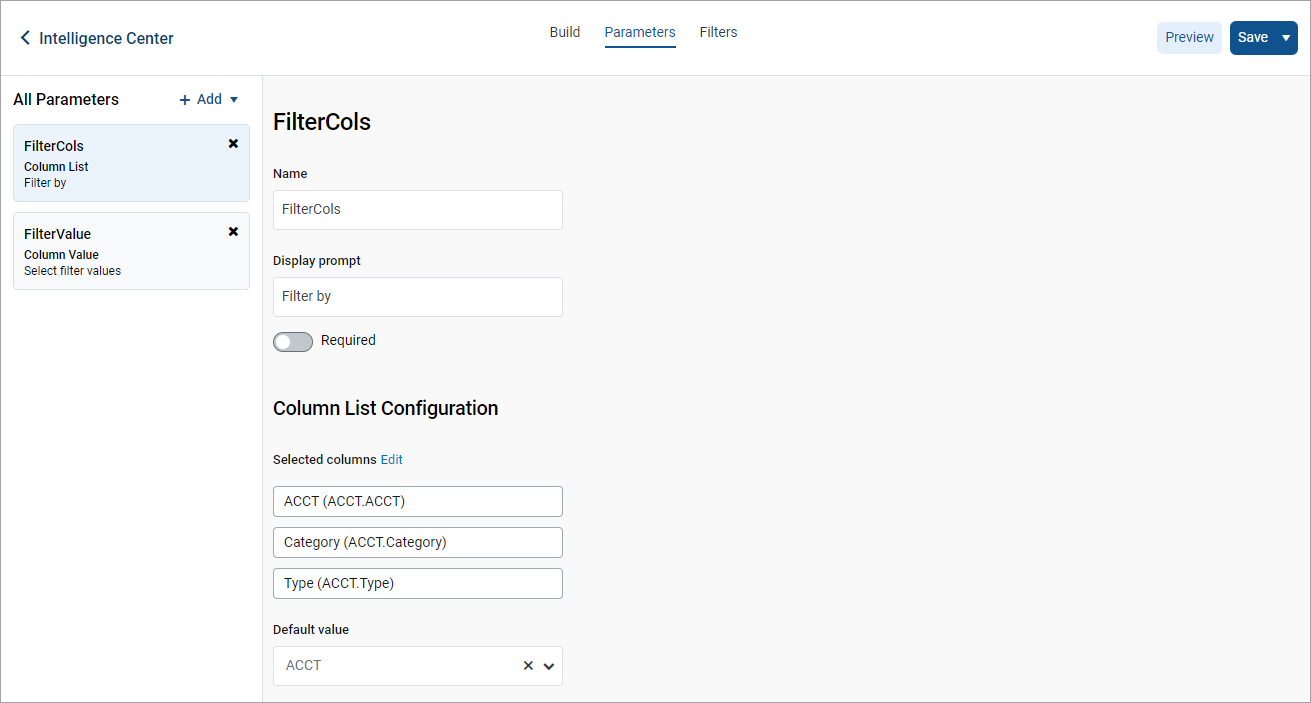
Click Parameters and select ColumnValue with the Static column option. The ColumnValue report parameter is listed in the All Parameters section. Click the Edit button next to the name of the select column to open a window where you can configure your parameter.
Select column dialog box
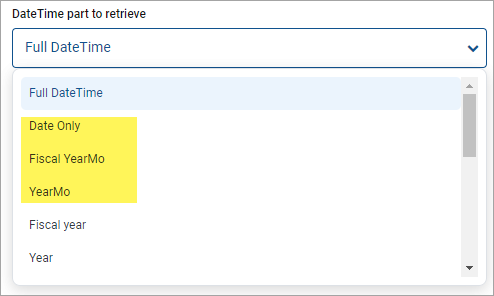
In this example, Year is selected as the date part to retrieve.
When you view the report, you can select date parts. In this example, you are viewing entries for the year 2019.
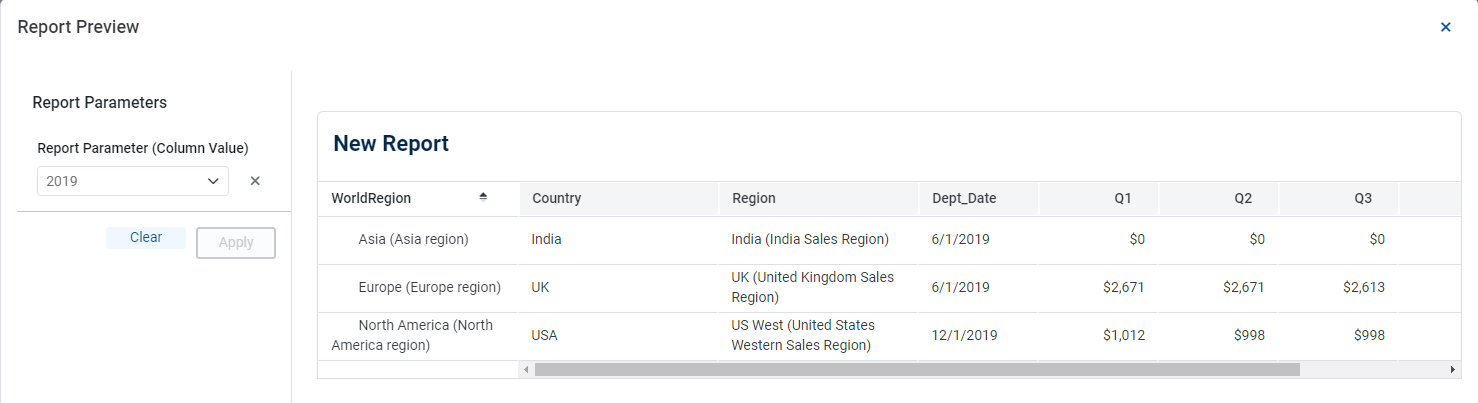
Sample report showing date parts in ColumnValue
ColumnList
You can use date parts in a report with a ColumnList, which is similar to ColumnName.
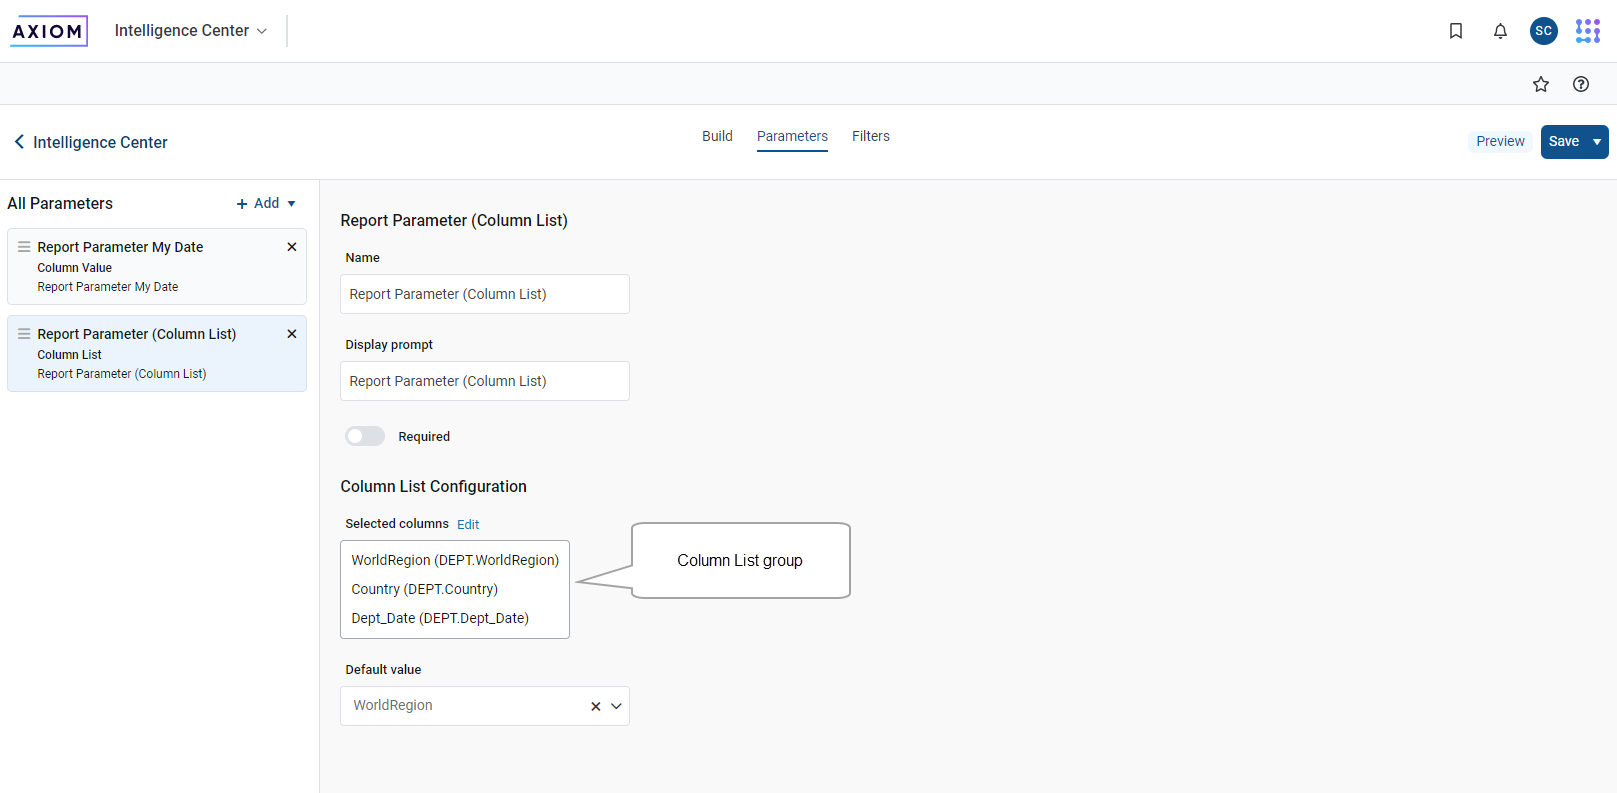
Dates parts in Column List
DatePart support in drill column configuration
You can now configure the DatePart in a drill column configuration.
Star with a report, such as this one:
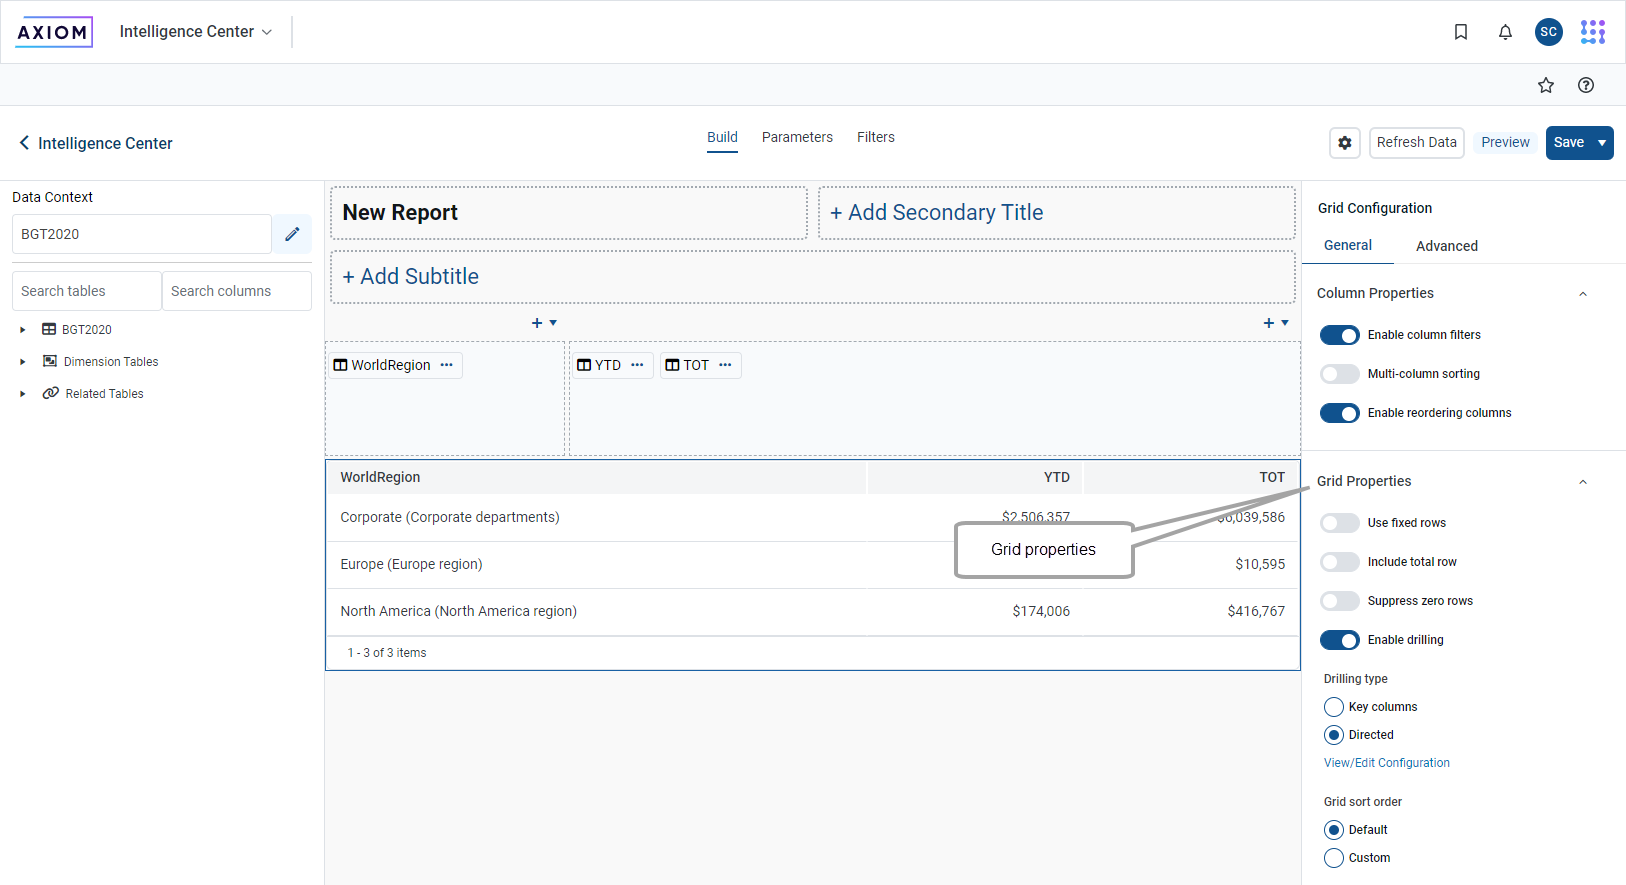
Enabling drill properties for data grid
In Grid Properties in the right sidebar, enable drilling and select the Directed drilling type to configure. Choose the Directed option and click View/Edit Configuration to get started.
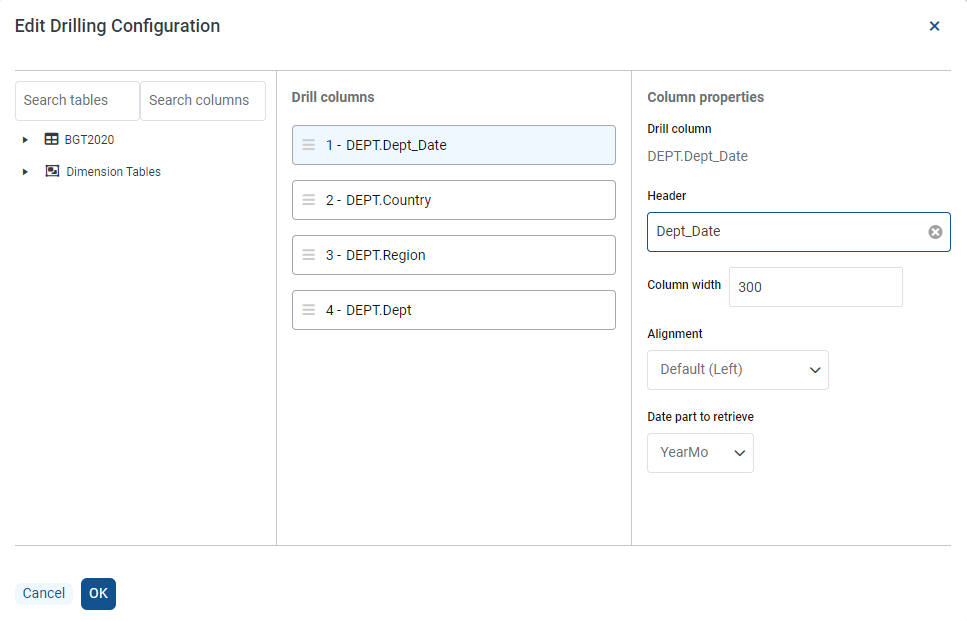
For this report, drill down World Region at the following levels and set the data part to retrieve to retrieve YearMo.
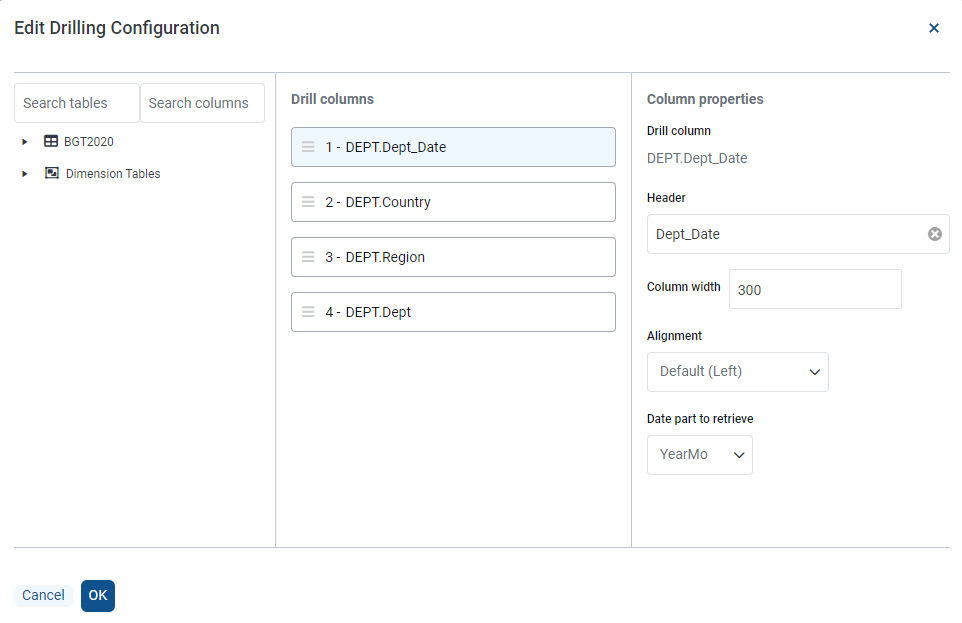
Editing drilling configuration
When you view the report, if you hover on Europe, the drill icon is displayed. When we click Europe, we see Dept_Date configured as YearMo and the drill results are grouped by that date part.
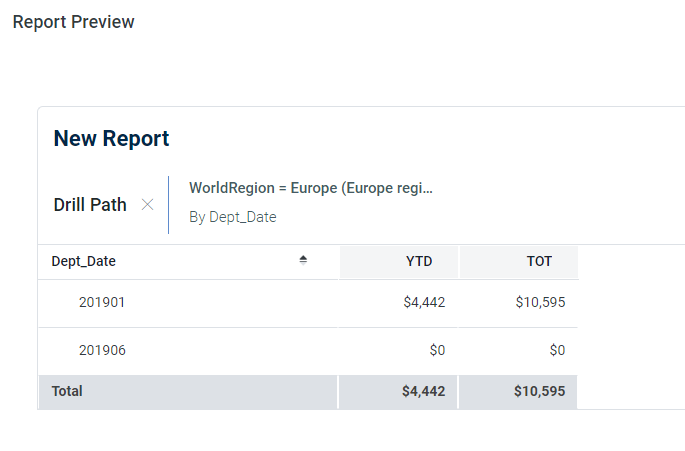
Example of drill with date part support
Change numeric column formatting
You can now more easily change the format of numbers in your report. When you build a report, this feature is turned off:
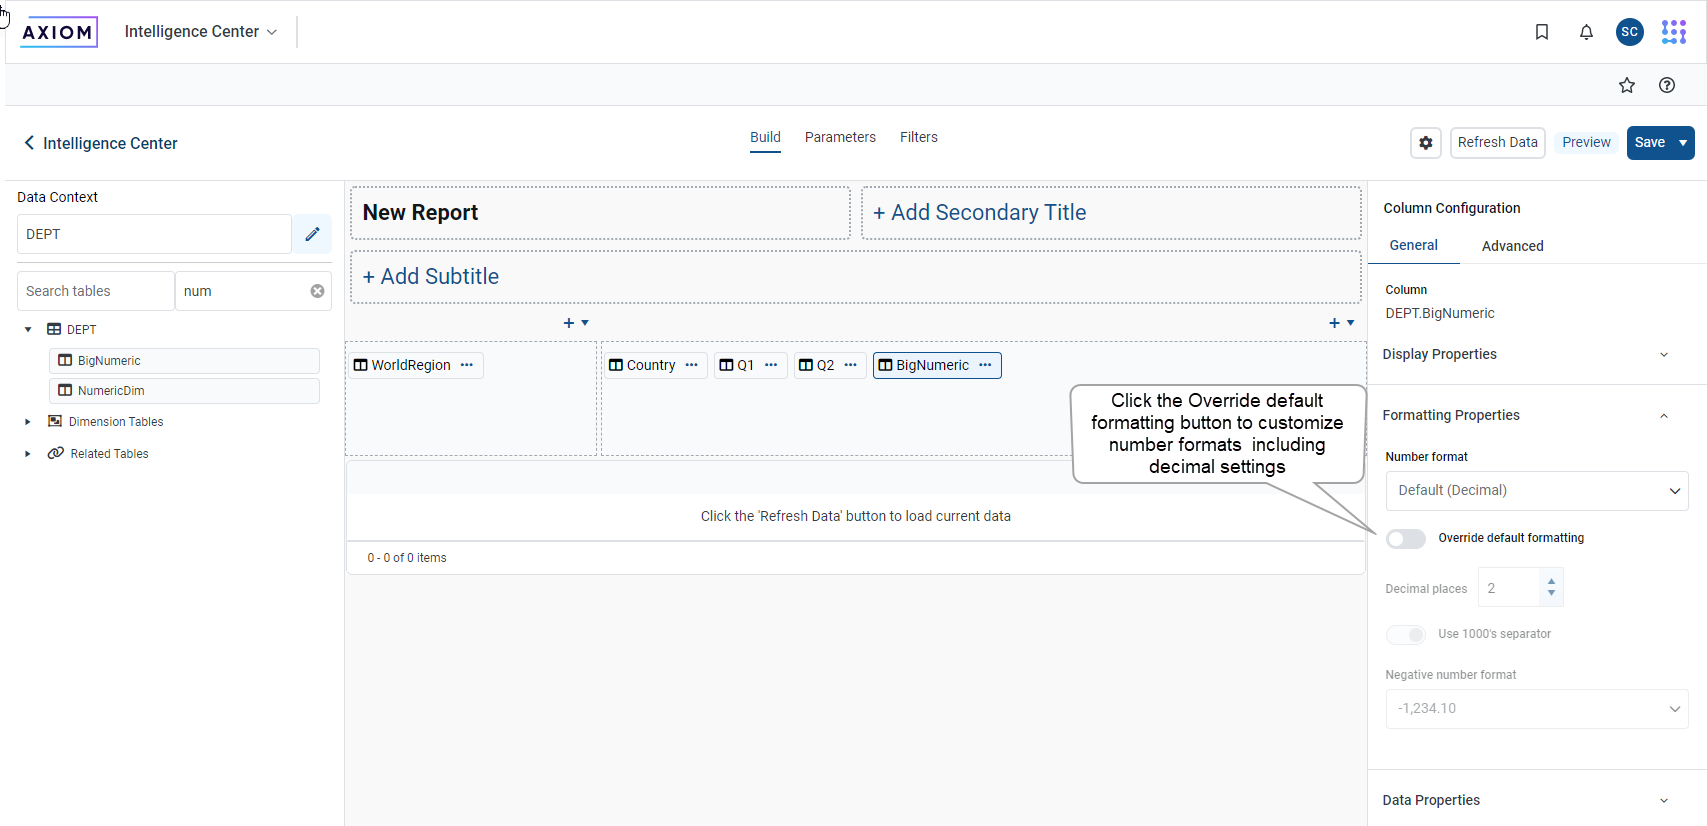
Number formatting in report
Click the Override default formatting button to turn on:
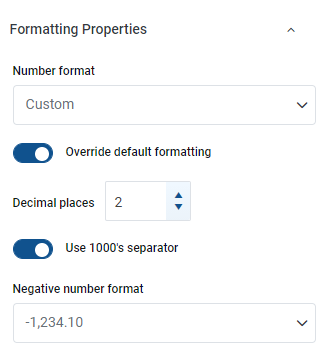
Number format section
Use the number format section to:
-
Set the number of decimal places to use.
-
Determine whether to use a 1000's separator, as in 12,000. You can turn off that button to not use a separator, as in 12000.
-
Determine how to display negative numbers, such as -150.15 or (150.15.). Additionally, you can show the value in red.
Grouping of column configuration properties in Report Builder
To improve the user experience, the column configuration properties have been grouped in the sidebar for ease in selecting and setting up properties.
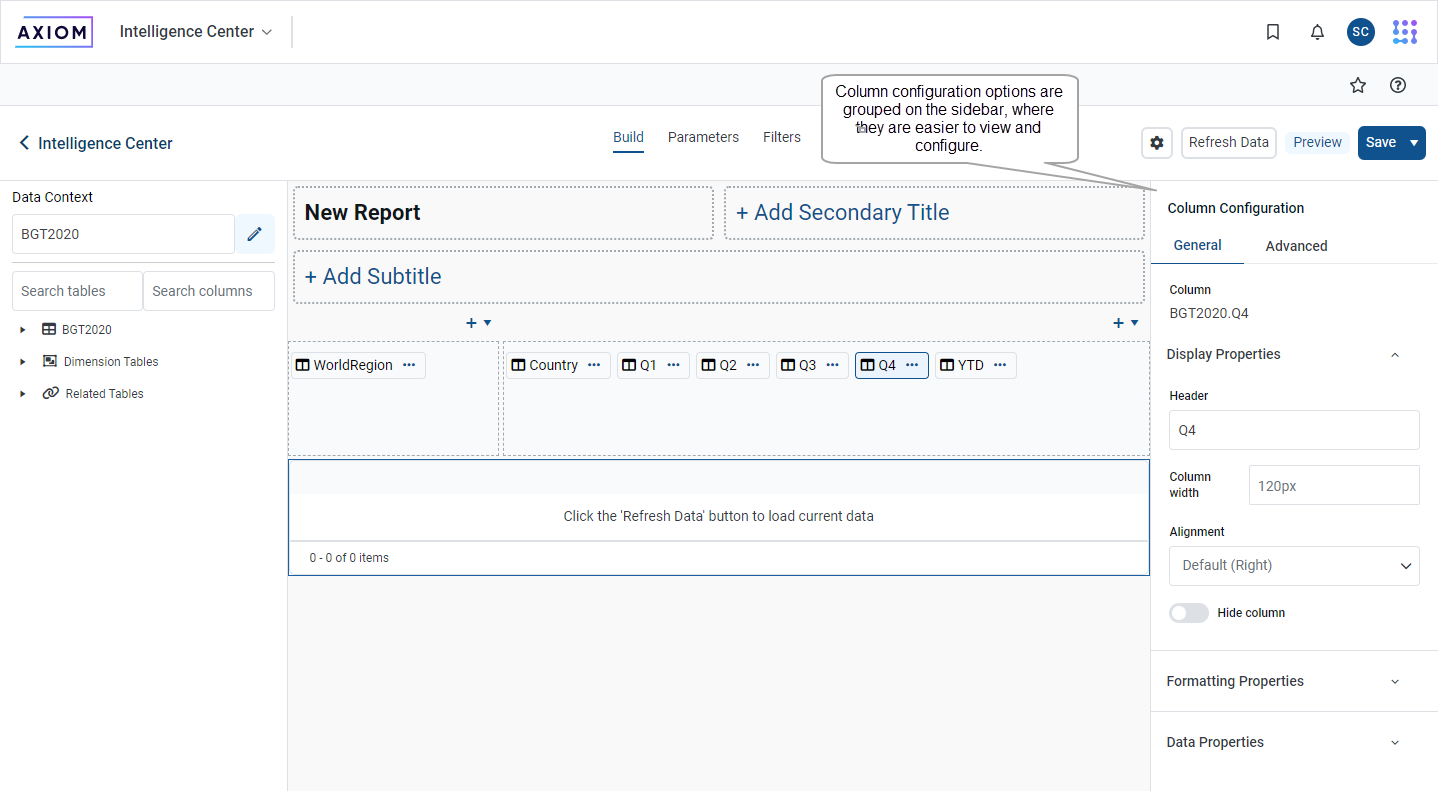
Grouped column configuration properties
The column configuration section includes three areas for configuring different aspects of the column.
Use Display Properties to set a title for the column, the width or the column, and how the text is aligned. You can also choose to hide the column in the report.
Use Formatting Properties to show a description of the column, and choose how that description will be displayed.
Use Data Properties to choose how the data is aggregated. Options include:
-
Max (the default option)
-
Count
-
Min
-
DistinctCount
The Data Filter box lets you create a filter for the column.
Disable dimension mapper with large reference tables
When building a fixed row structure with large tables (such as the Encounter table) dimension mapping is now disabled, as it can cause performance issues. Instead, you can use the filter wizard to define that row in a report.
Other enhancements
Export audit logs to Microsoft Excel
To improve productivity and maximize your understanding of how Axiom is used, you can now export audit logs to Microsoft Excel for further analysis.
The Audit Manager page presents a list of the most recent activities that can be filtered by:
-
date range
-
activity type
-
user
-
document
-
table
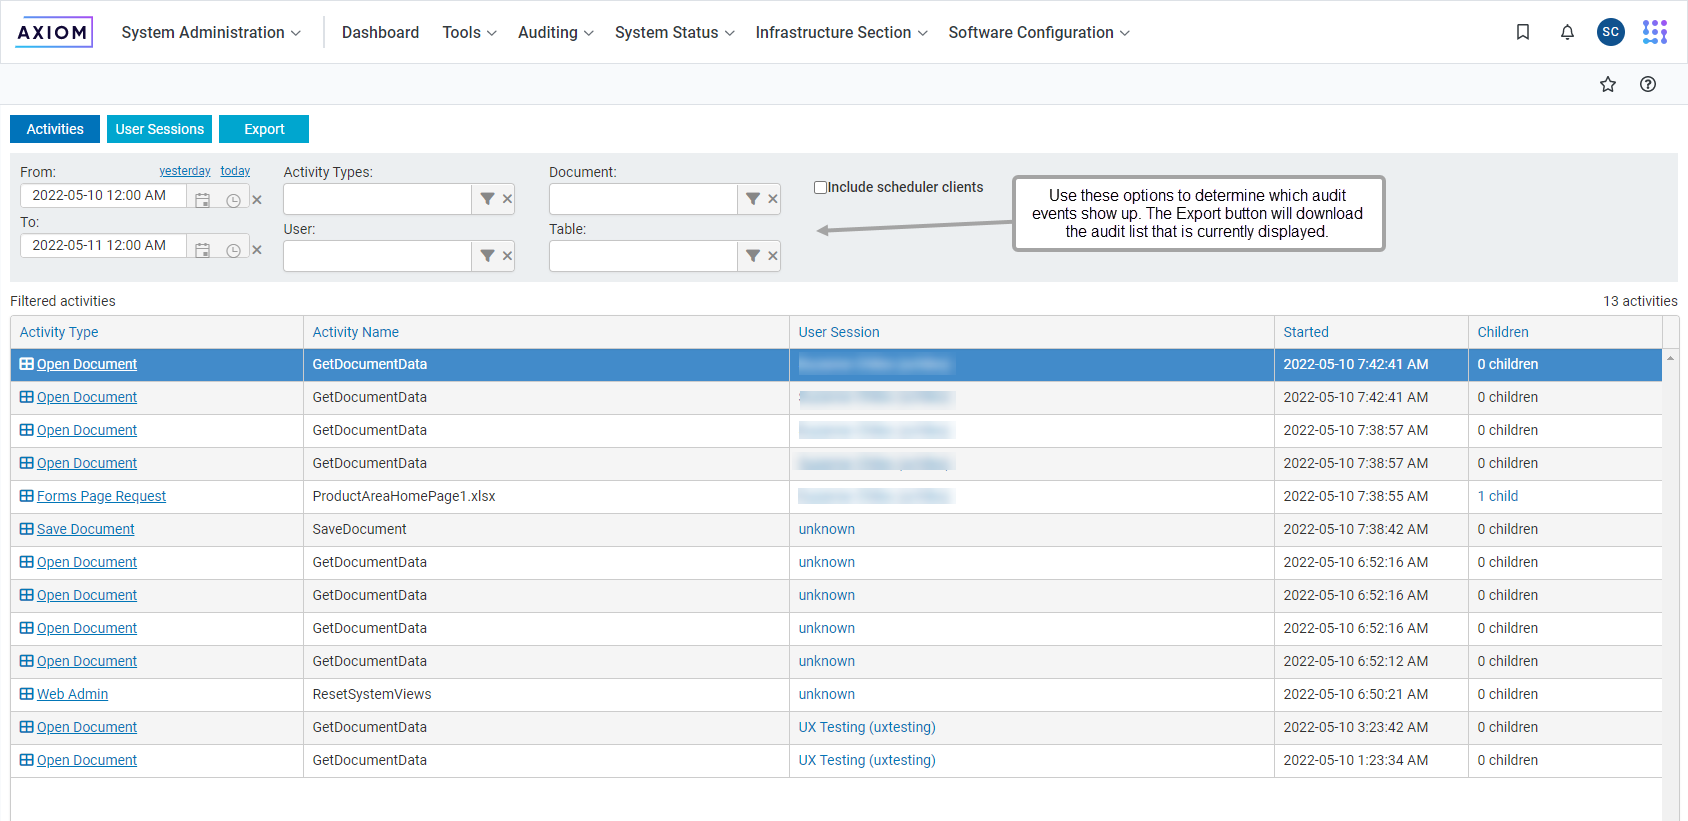
Audit manager page
The list of activities is refreshed as you use the selectors. When you have defined the content you want to view, click Export to download the content as a comma-separated-value (.csv) file and open it in Excel.
New features and enhancements in previous release
The following features and enhancements were introduced in 2022.1.
Updated Web Client navigation
- Navigation menu now easily accessible across the top instead of within a side panel
- Area menu and Launch menu combined into a single menu for quick access to different product areas and applications
- New Bookmarks panel for easy access to favorites and recent items
- Streamlined and updated Notifications panel
- Overall presentation and styling updated to match current standards for user experience and design
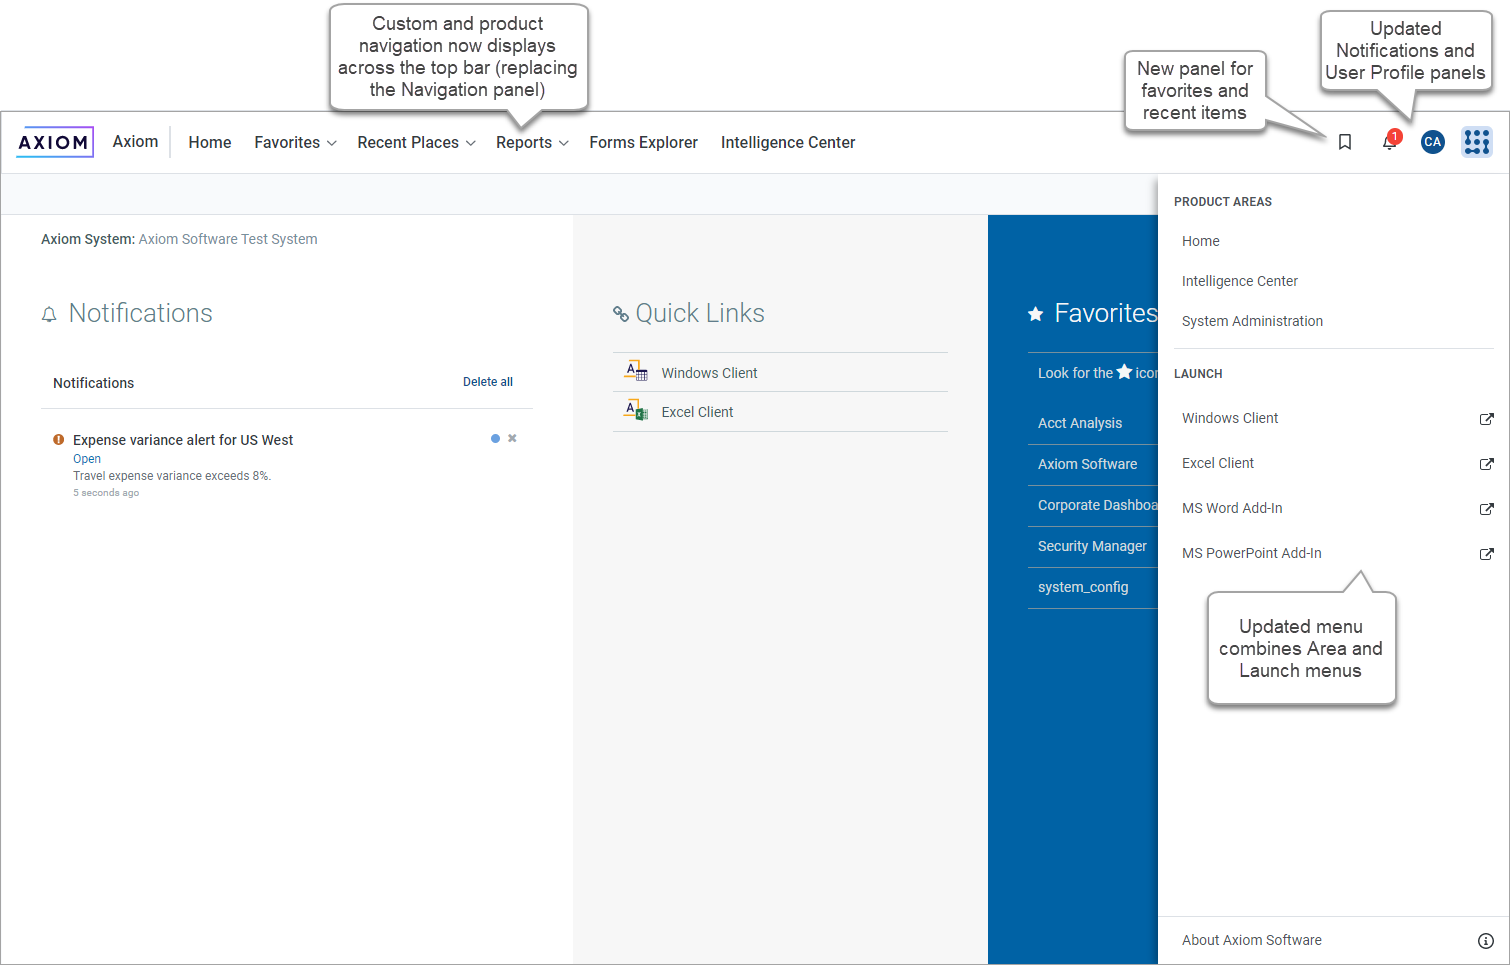
Example updated navigation bar
The navigation menu across the top is context-sensitive. For systems with installed products, it displays the menu for the current product area. If you are in the System Administration area, it displays the System Administration menu.
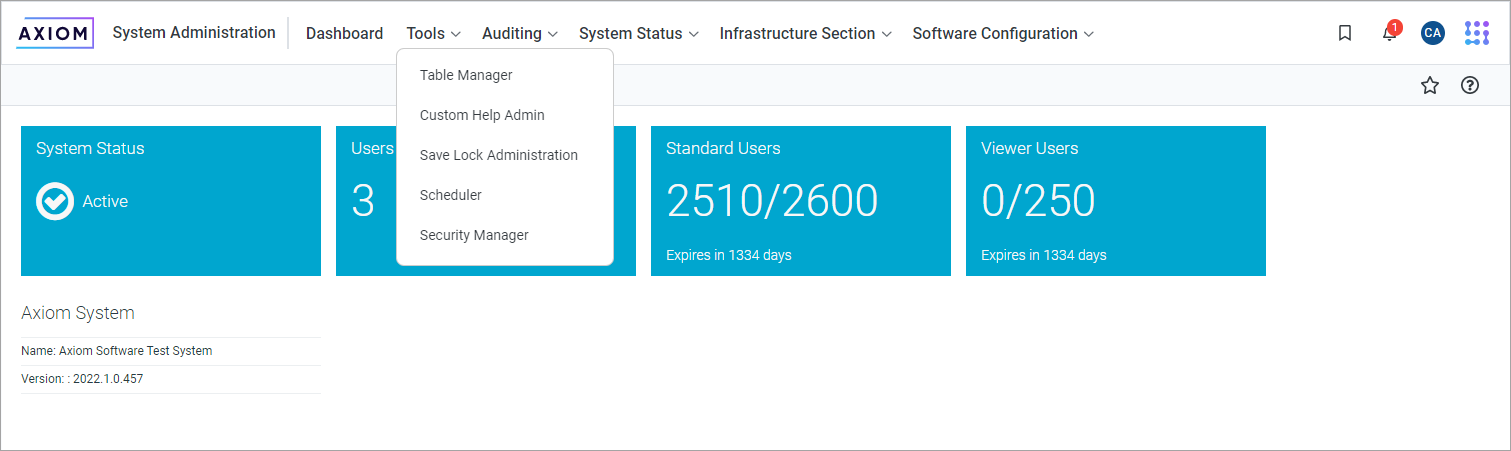
Example System Administration menu in updated navigation bar
The task bar below the navigation bar also has updated styling. All task bar features except the navigation panel continue to work the same way as they did before the update.
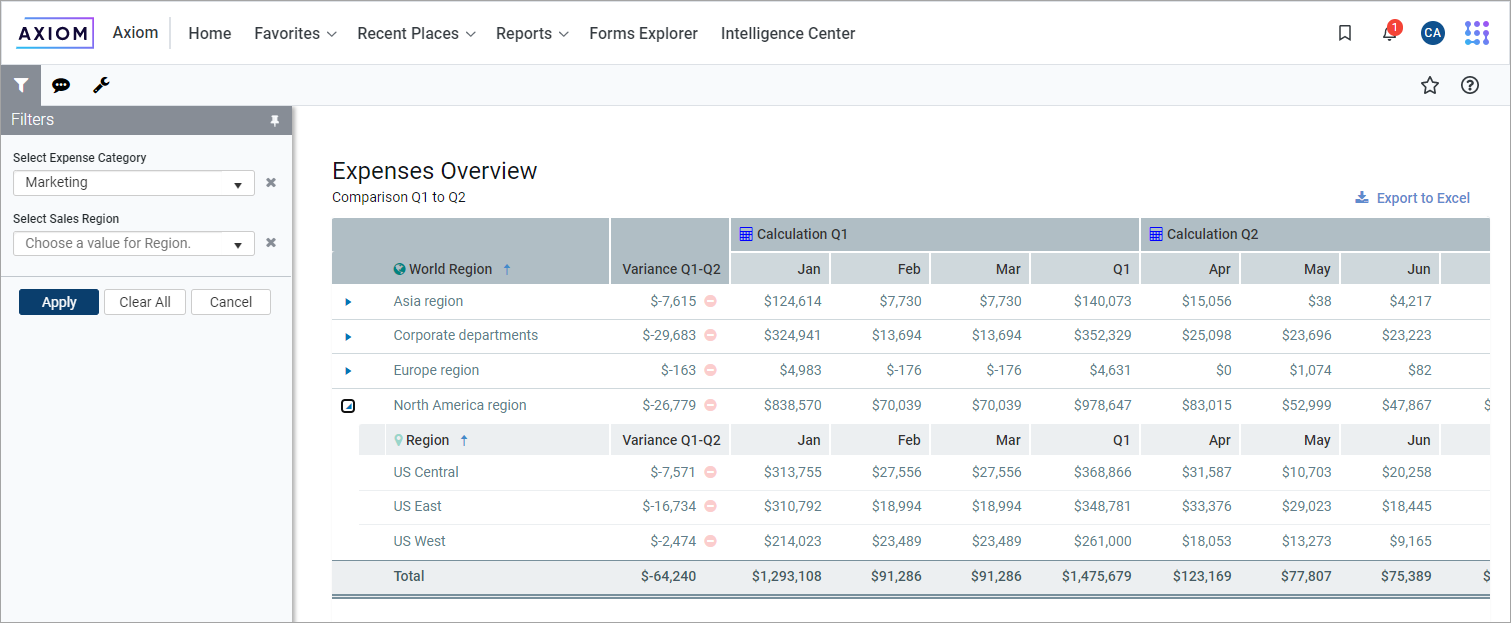
Example form showing updated task bar
The new navigation is automatically available in the Web Client. Your existing custom web navigation items will work seamlessly in this new environment. Although no manual adjustments are necessary for continued operation, custom clients may decide to make elective improvements to optimize the use of the new navigation. For more information, see Updating your Web Client navigation bar.
New Filter Wizard in the Report Builder
The Filter Wizard in the Report Builder has been redesigned to make it easier and more intuitive to create filters that impact report data. The new Filter Wizard is available to create report-level filters, as well as filters on individual columns, calculations, and column groups. Improvements include:
-
Ability to quickly search for specific tables and columns within the wizard
-
Enhanced ability to browse, search, and select existing values within a column to create the filter
-
Intuitive and simplified presentation of each filter statement to more easily define, edit, and understand the complete filter
-
Improved user experience for creating compound filter statements, including drag and drop design and visual representation of statements combined using AND/OR
-
Ability to use predefined filter statements as global filters or as starting points for custom filters (see next section for more information)
-
Improved context-sensitivity when defining filters for columns, calculations, and groups so that only tables relevant to the current context are shown
New Filter Wizard in the Report Builder
Additionally, report-level filters have been moved from their previous location in the Report Configuration panel to a separate Filter tab. This new location makes it easier to review and manage all of your report-level filters.
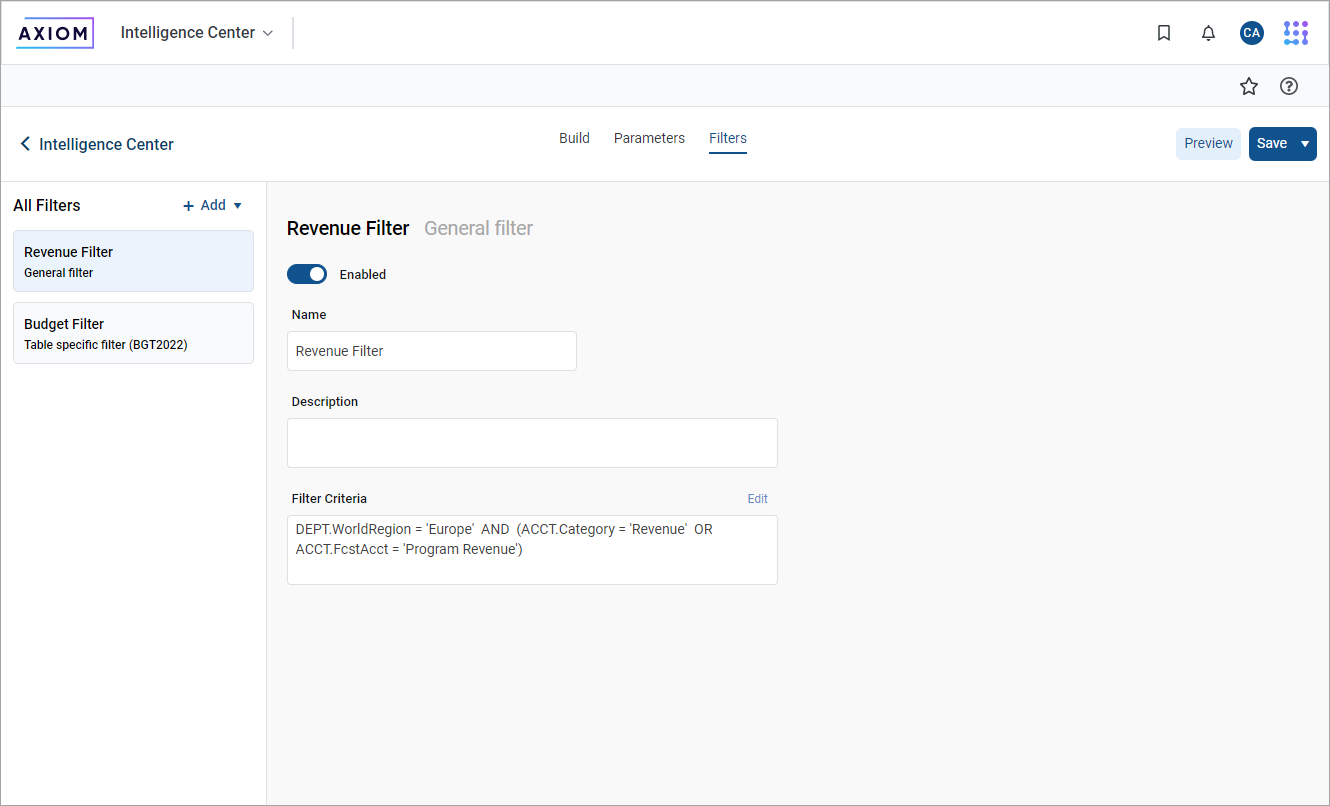
New Filters tab in Report Builder
For more information on using the new Filter Wizard in the Report Builder, see Using the Filter Wizard in the Report Builder.
Filters created using the new Filter Wizard use a different underlying structure than existing filters. Your existing filters will be migrated to the new structure when the report is opened for the first time after upgrading to 2022.1. The vast majority of filters will be migrated without issue, however, there are a few existing filter configurations that will not migrate. For more information, see Upgrade considerations for web report filters.
Global filters in web reports
Web reports now support the concept of global filters. This means that the report can reference a filter stored in the centralized Filter Library instead of saving the filter directly in the report. If the global filter in the Filter Library is updated, the report will automatically use the updated filter criteria, without needing to edit the report.
For example, imagine that you are a healthcare organization and you want to filter various reports by codes relating to COVID-19. You create a filter with the codes and save the filter in the Filters Library, then reference the filter in the reports. Later, if you need to add a new code, you can edit the global filter. All reports that reference the global filter are now automatically filtered by the additional code.
Using the new Filter Wizard in the Report Builder, you can now:
-
Create a filter and then save it to the Filter Library for future use
-
Use a filter from the Filter Library to create a global filter in the report—both new-style filters and existing legacy filters can be used
-
Combine global filters with "local" report-specific filters as needed
-
Convert a global filter reference into a local filter within the report, so that the filter is no longer tied to the global filter in the Filter Library
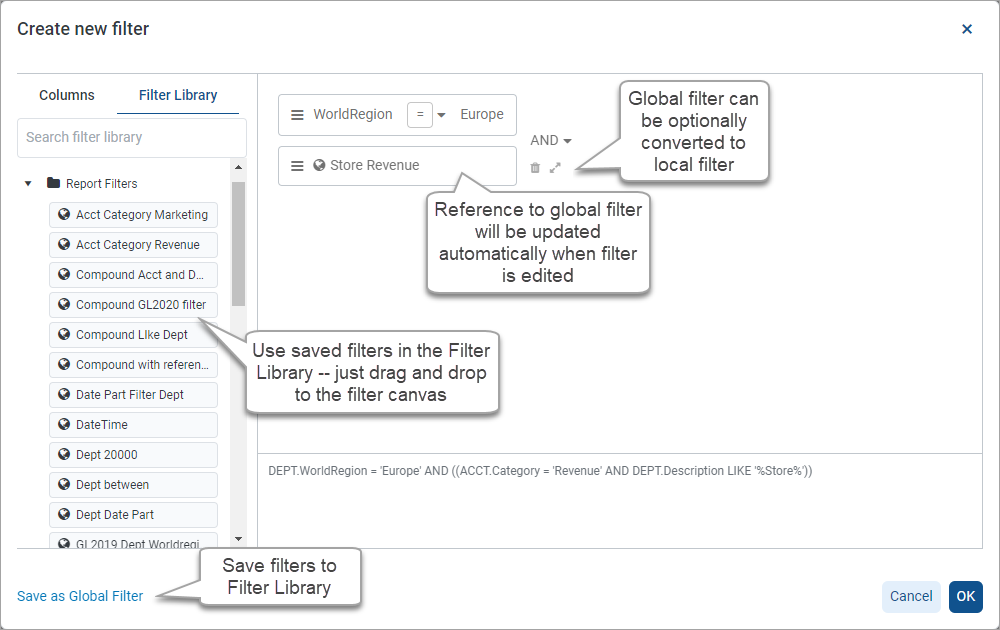
Filter Library in new Filter Wizard to use global filters
Currently, any filter created and saved to the Filter Library from the new Filter Wizard can only be used in web reports. Future releases may expand the use of the new Filter Wizard to other areas of the application.
The term legacy filters refers to filters created using the previous version of the Filter Wizard and saved to the Filter Library. Only regular legacy filters can be used as global filters in web reports. Limit filters cannot be used at this time.
For more information on using global filters, see Using global filters in the Report Builder.
Filter web reports by process columns and date parts
Using the new Filter Wizard in web reports, you can now filter the report by process columns or by date parts. Both of these options are new—it was not previously possible to create these types of filters in the legacy Filter Wizard.
Date part filters
For Date and DateTime columns, you can specify a date part to base the filter on, instead of basing the filter on the full date or date-time. For example, you can specify Quarter as the date part and then create a filter to only show records where the date is in the second quarter. You can select any of the available date part options and use any of the valid values in the filter.
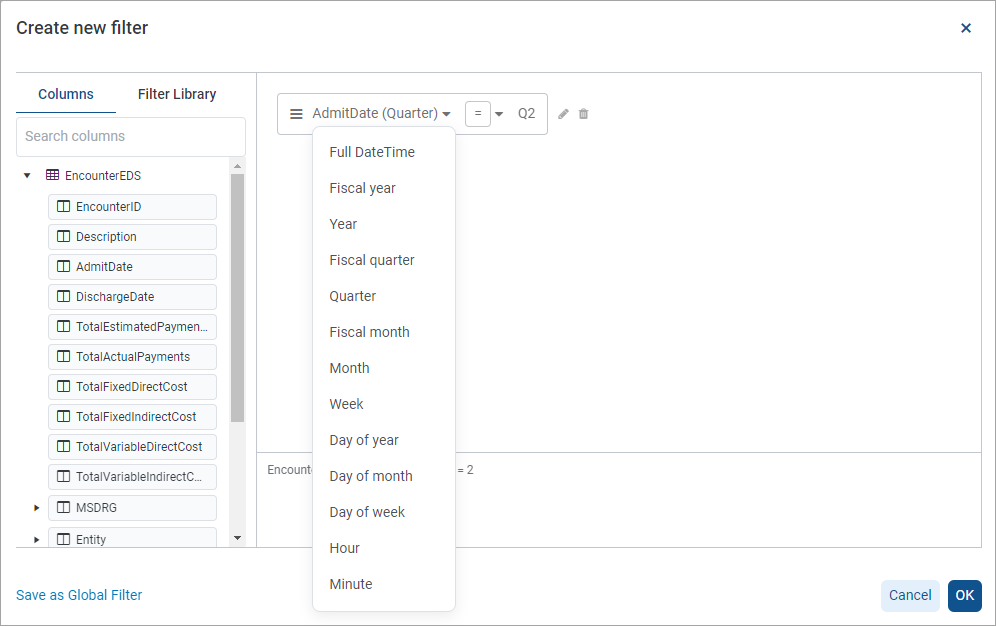
Date part selector for creating date part filters
Process management filters
If a report is configured to show process management columns, you can create a filter based on useful process information. For example, you can filter the report to only show plan files in a particular step or with a particular status, or in relation to the time spent in a step.
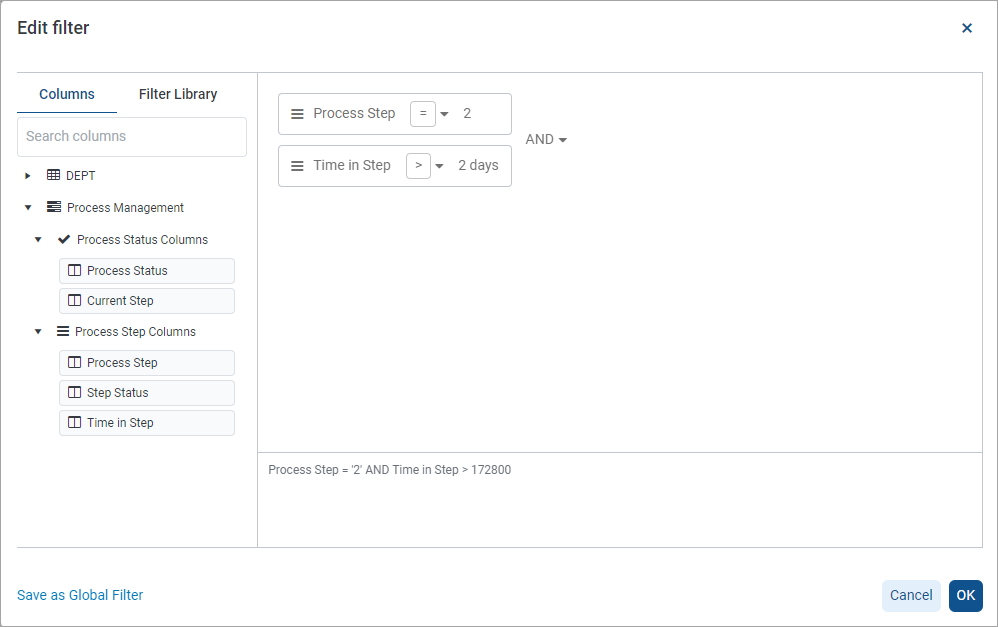
Process Management columns in the Filter Wizard
Display hyperlinks in web reports
You can now display active hyperlinks in web reports, so that report viewers can use the hyperlinks to navigate to supporting detail or related information. This feature is intended for cases where each row of the report has a corresponding link, and these links can be generated dynamically based on a value relating to the current row data.
For example, if the rows of the report represent department codes or capital request codes that are active in a plan file process, you can dynamically generate a link to the process routing page for each code. Report viewers can click on the links to view the process details for particular codes as needed.
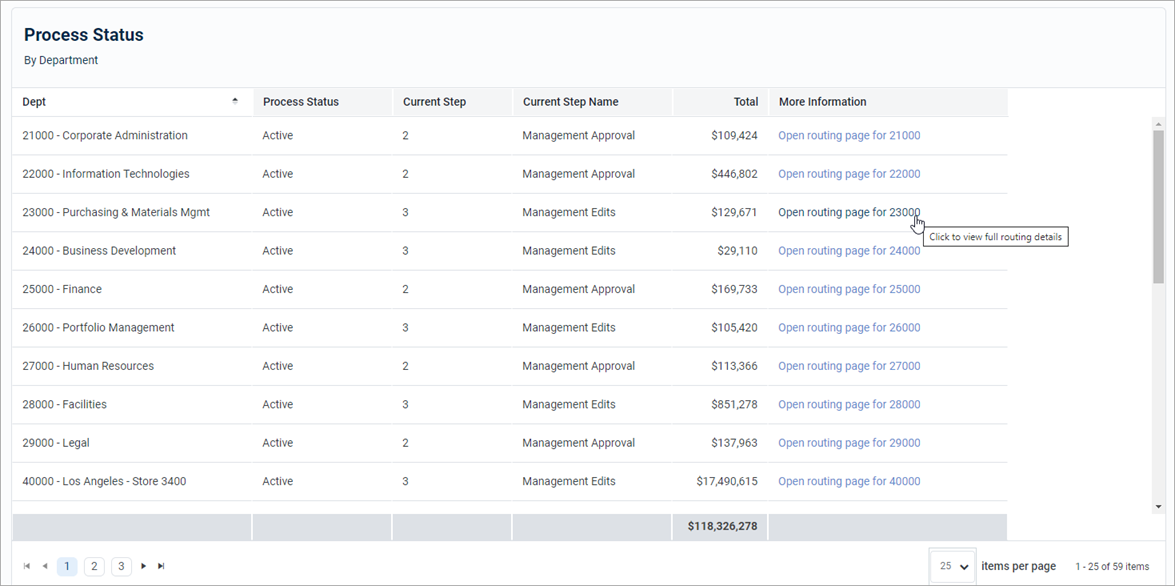
Example report with a hyperlink column
You can define two different types of links in web reports. Hyperlinks are enabled and configured at the column level, in the Column Configuration properties.
-
Custom: Link to any page in the Axiom system by entering a relative URL. Variables can be used in the URL so that it is unique per row of the report.
-
Plan File: Link to any set of plan files in the Axiom system. When using this option, Axiom dynamically generates the URL to each plan file on a per row basis, given a file group context. The row dimension of the report must be the key column of the plan code table in order to generate the links.
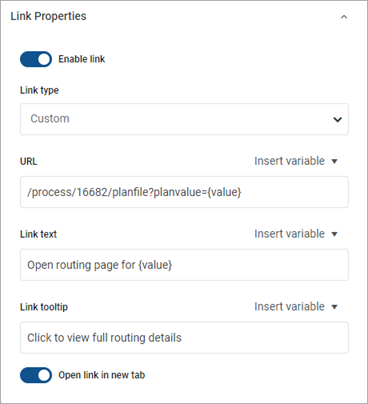
Example hyperlink properties
For more information on using hyperlinks, see Displaying hyperlinks in web reports.
Use date parts in Axiom queries
You can now report on Date and DateTime columns using date parts in Axiom queries. When using date parts—such as Year or Month—the column data is effectively transformed into the specified date part for purposes of the report. This allows you to not only display the specified date part, but also group, sort, and filter the query by the date part.
In order to use a date part, use the following syntax in the field definition of the Axiom query:
AxDatePart(ColumnName,DatePartName):SpecialColumnName
-
ColumnName is the table.column name, such as Encounter.AdmitDate.
-
DatePartName is the name of the date part to return, such as Year, Month, YearMo, or Quarter. All of the date parts that are available for use in web reports are also available for use in Axiom queries.
-
SpecialColumnName is an optional defined name for the transformed column, so that you can reference it in the sum by, data sort, or data filter for the Axiom query. The name can be omitted if you do not need to reference the column elsewhere.
For example, the following report uses date part syntax to group, sort, and filter the report by the YearMo date part:
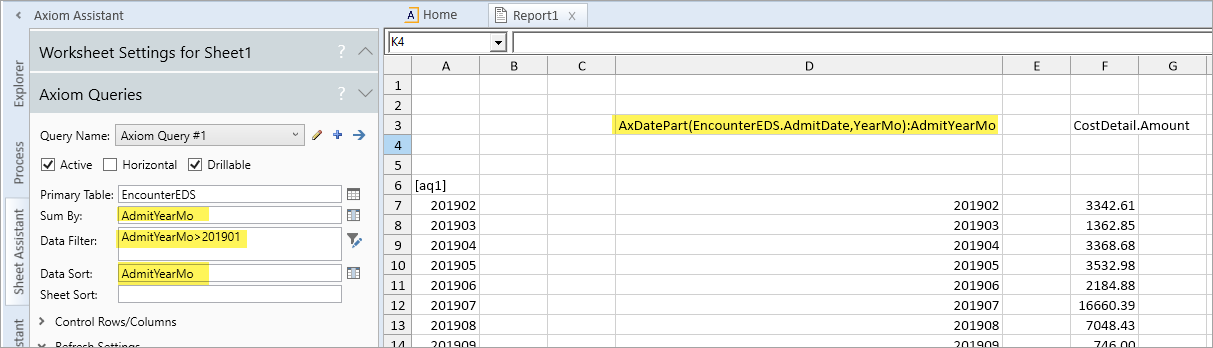
Example Axiom query using date part syntax
For more information on using date parts in Axiom queries, see Using date parts in Axiom queries.
Additional Report Builder enhancements
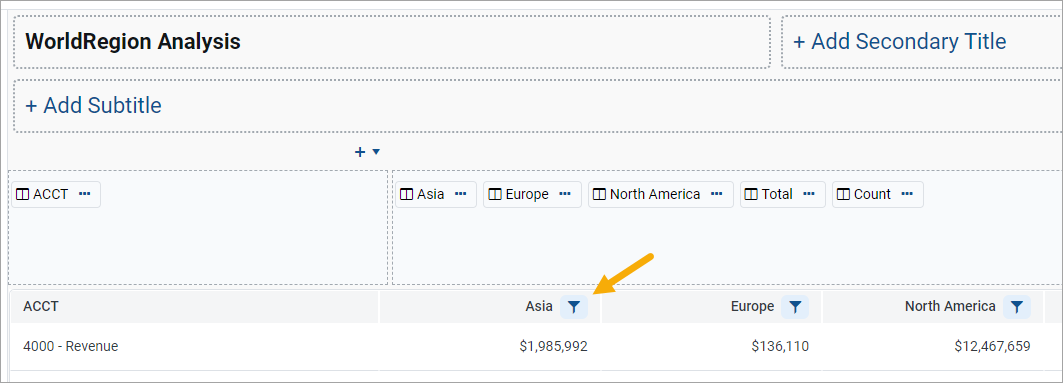
-
Columns and column groups with filters now display with a filter icon in the Report Builder. This makes it easy for the report designer to see at-a-glance that a particular column or group is being filtered.
-
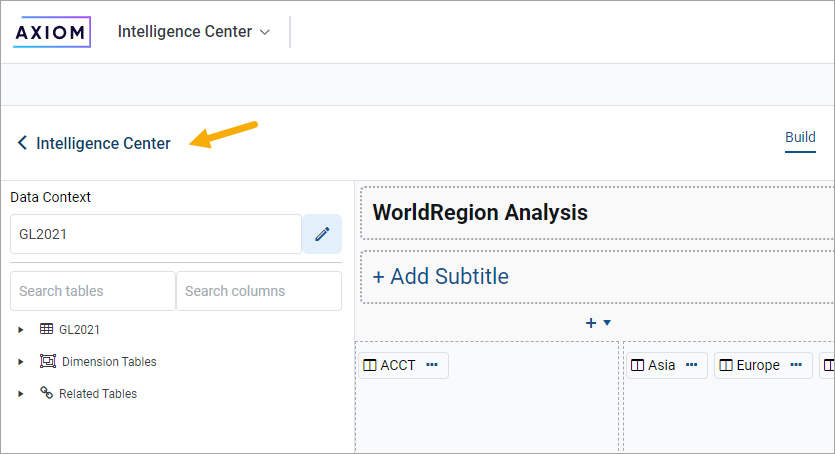
An Intelligence Center breadcrumb is now available in the Report Builder, to quickly exit the report and navigate to the Intelligence Center.
-
The Parameters tab of the Report Builder has been updated to match the styling of the new Filters tab. Previously each parameter had a set of general properties that displayed in a right-hand panel, and a set of parameter-specific properties that displayed in the middle panel. These properties have been combined into a single panel.
-
Several new date parts are available for Date and DateTime columns. These date parts expand the available options to display, group, and filter by date and date-time values.
-
You can now set default formats for Date and DateTime columns at the grid level of a web report, using the Grid Configuration settings. Any Date or DateTime columns that use the default formatting will inherit any changes made here.
Additional enhancements
The Purge System Data task now deletes expired announcements when it runs. By default, the task deletes all announcements that are 30 days past their configured expiration date. This setting can be configured as needed using the System.SystemDataPurge system job.
