Payroll visualization
The Payroll visualization contains salary and payroll data for all employees at your financial institution.
Click image to view full size
Filters
This visualization lets you filter the results by:
-
Account
-
Department
-
Employee
-
Plan code
-
Year month
When you choose an option from a filter, the options from the remaining filters are amended to show only the selections that are valid given based on the filters already chosen. For example, the Employee menu lists every employee at the financial institution, numbering in the dozens. However, if you choose a Plan Code, such as Finance, the Employee menu will only show the employees associated with HC Finance, 12 employees in total. Your filter selections are listed in the Filters section.
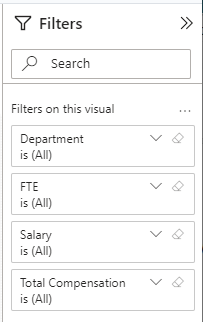
Use the down arrow in a category to further filter the data in that category. Options include:
-
Selecting one or more entries from the list of values for the category
-
Using simple logic statements, such as "contains" or "starts with," to filter contents. You can create multiple statements and use "and" or"or" to create a more complex condition
-
Viewing the top n entries in the list, where you define the n value
TIP: To reset the visualization to its original setting, you can refresh the page by clicking Cntrl + R or right click your mouse and select Refresh.
TIP: To reset one of the categories to its original settings, move your mouse to the right of the category label to view the eraser icon. Click the eraser icon to reset the category
NOTE: Some filtering options may not be available in certain categories.
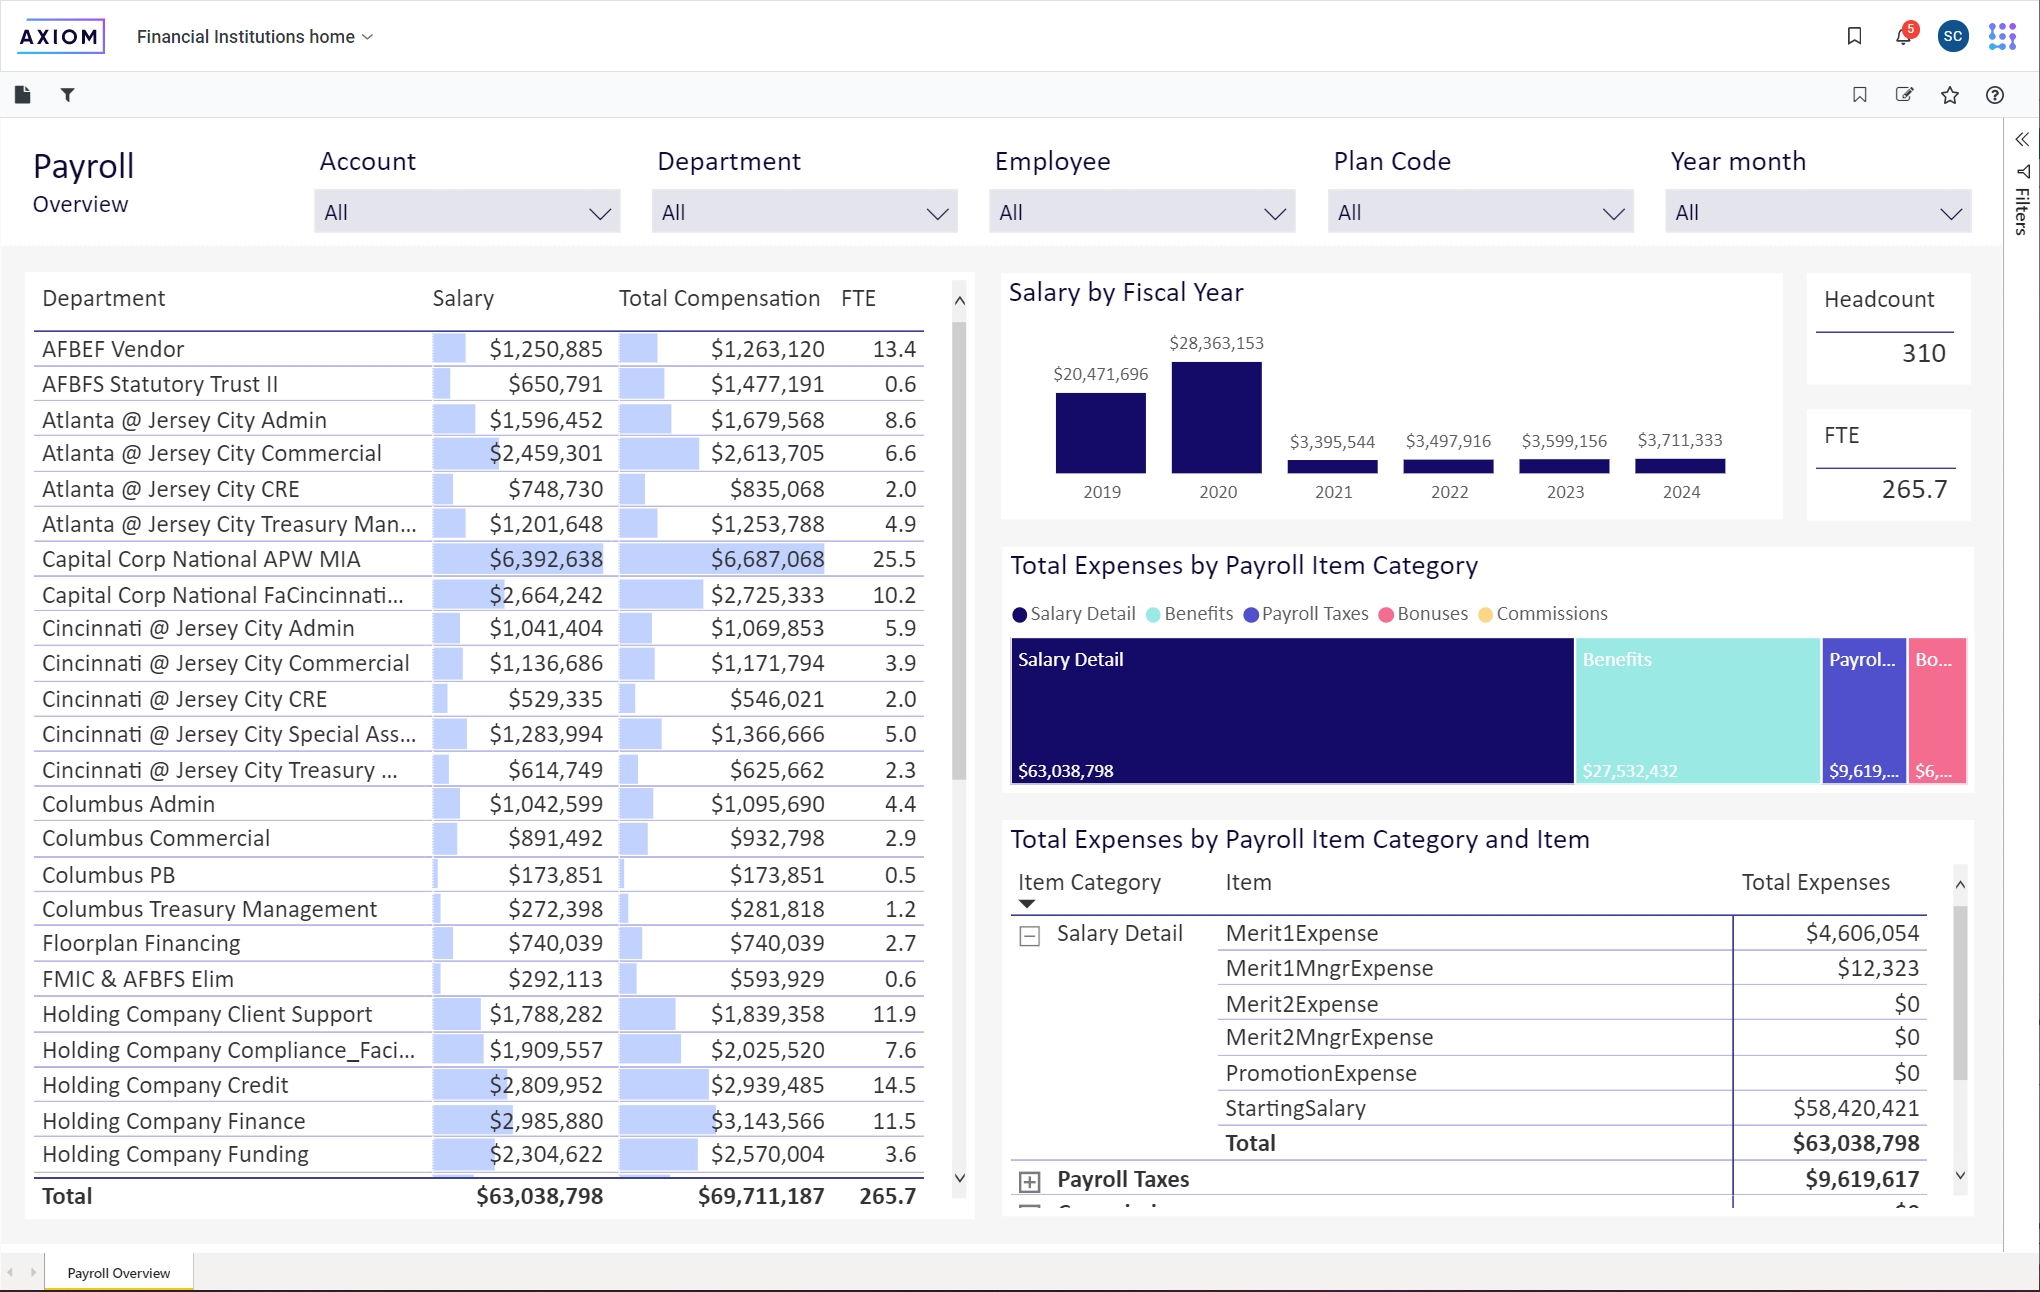
Report data visualizations
The Payroll report contains several data visualizations.
Overview
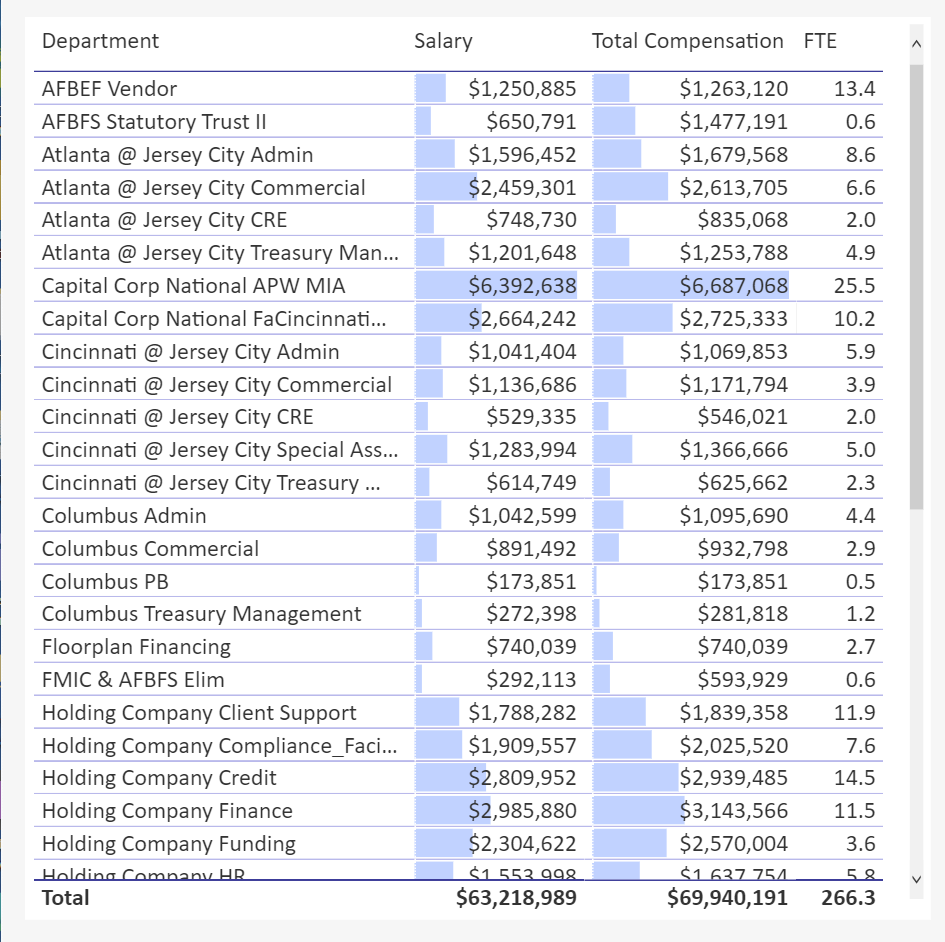
Click image to view full size
This table contains data about salaries organized by Department. For each department, you see the total salary for all members of that department, the total compensation, and the count of Full Time Equivalent (FTE) hours.
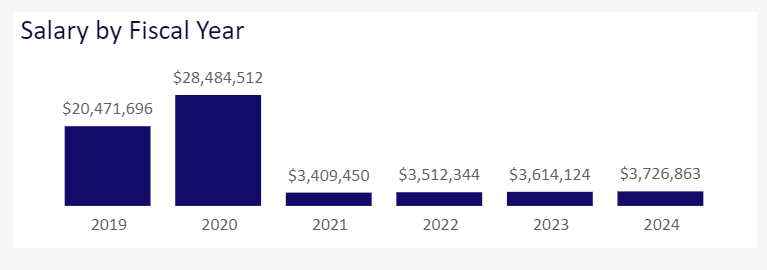
Salary by Fiscal Year
This bar chart shows the total salary for all employees, by year.
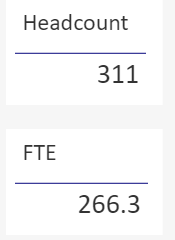
Headcount and FTE
These tiles provide the total headcount for your organization as well as the total of FTE hours.
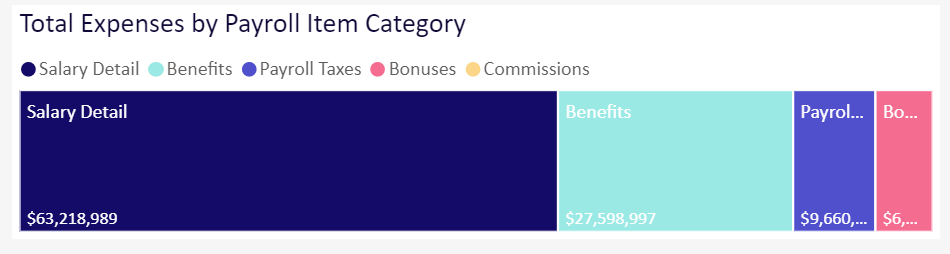
Total Expenses by Payroll Item Category
This graph show the total payroll expenses for your organization by category. The categories are Bonuses, Salary Detail, Benefits, Payroll Taxes, and Commissions.
Total Expenses by Payroll Item Category and Item
This table shows the same data in the Total Expenses by Payroll Item Category and lets you expand a category to select an item for filtering the data shown.
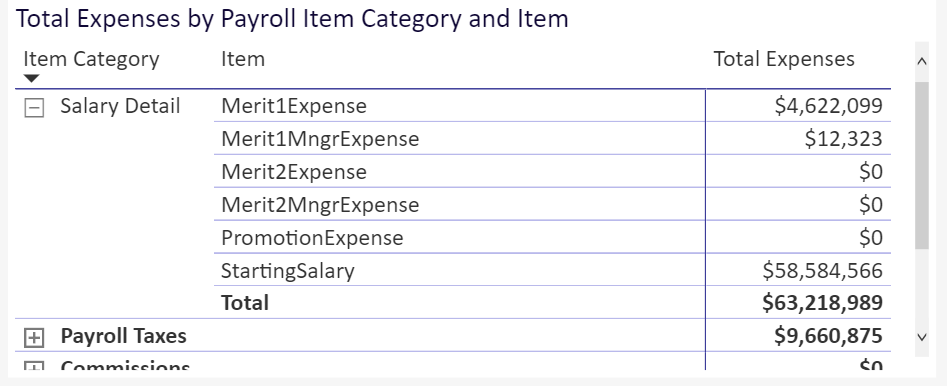
This example shows the expenses by the items that comprise the Salary Detail category.
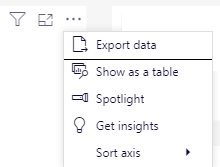
Using visualization data
Each visualization in this report has options for viewing and exporting the data. Hover over the top right corner of the visualization to view those options.
See Visualizations for tips, tools, and techniques for viewing and working with visualizations.
