About the Cost Reduction Status report
The Cost Reduction Status report is a forms-based report that displays performance results from Initiatives that have cost-saving measures from a specific measure class A means of grouping measures in a way that fits your organization's needs.: PI-Dollars-Performance Improvement. Performance Improvement measures are those that involve some sort of cost reduction or savings, or improvements to performance that result in a cost reduction, savings, or revenue enhancement.
The report displays the actual savings and the cost savings goal of each performance-improvement Initiative for the current period and over a set time span, which for this report is the fiscal year of the Axiom Strategy Management Current Period year and month (YRMO).
The report includes the following:
- Actual savings amount for the current period and for each period that contains data in the current fiscal year (YRMO)
- Fiscal year-to-date savings for each Initiative and cumulative savings of all Initiatives
- Fiscal year-to-date savings goal for each Initiative and cumulative savings of all Initiatives
- Project-to-date actual savings for each Initiative and cumulative savings of all Initiatives
- Project savings goal for each Initiative and cumulative savings of all Initiatives
In addition to the Table, the report also contains bar charts that display these same savings cumulatively. For details, see the following sections,
Axiom Strategy Management executives can use this report to monitor the achievement status of cost management initiatives at any time, on demand. This report is also available to system administrators and users who own or sponsor Initiatives included in the report.
The PI-Dollars-Performance Improvement class comes with one default measure of the same name: PI-Dollars-Performance Improvement. Axiom Strategy Management administrators can create more measures using this class if needed. When a measure from this class is applied to an Initiative, the Initiative becomes a cost-saving/performance-improvement Initiative.
The PI-Dollars-Performance Improvement measure acts as a filter for the Cost Reduction Status report. Any Initiative with at least one measure of this class is included in the report, regardless of which department the Initiative comes from or how much money is involved.
IMPORTANT: All dollars captured using the PI-Dollars-Performance Improvement measure are included in the Cost Reduction Status report, so take care to avoid duplication of cost savings measures. If cost savings measures are duplicated in two different initiatives, they will also be added twice in the Cost Reduction status report. If you are using these measures in conjunction with your budget, then you risk double-counting savings, resulting in budgets that are unachievable.
The report has three parts:
- A filter panel on the left that controls which performance improvement Initiatives are included in the report
- Two bar charts that display cumulative data from those Initiatives
- A table that displays the data specifics of each Initiative.
The table and the graphs both list the Initiatives that are included in the report, but other than that, the graphs operate independently from the table. When you filter the report results, the table and graphs both refresh to display the report's new data parameters.
NOTE: Although clicking in the table causes the graphs to appear to refresh, the graphs are not actually changing; there is no correlation between what you click in the table and what you see in the graphs.
By default, the report includes all Initiatives that have a measure from the PI-Dollars-Performance Improvement class. You can filter the report to include only Initiatives from certain Perspectives, Objectives, sponsors, owners, etc.
The bar chart at the top of the report has three views:
- Trend (By Period)– Displays cumulative data by current period and year-to-date, and the cumulative projected goal and cumulative actual savings (uses fiscal year of the current period)
- By Group – Displays data by the selected group (i.e., Perspective, Objective, Sponsor, Owner, Workstream, Category, Status)
- Both – Displays both charts at once
You select which chart to view from the Chart to View drop-down in the upper right of the report. The charts and table are explained in the following sections.
The Trend chart displays by default. The selections in the Filters panel control which cost-saving Initiatives are included in the chart.
The chart includes the entire fiscal year for the Initiatives, and displays the cumulative actual savings and the savings goal that you expect to see by the end of the year.
- The dark blue bars show the current period cumulative actual savings, which you can see when you hover your mouse over one of the bars.
- The light blue bars show Fiscal Year-to-Date (YTD) cumulative actual savings. They display for every month, even future ones, but the future ones repeat the value for the last month for which there was cumulative data; they do not change until actual data is entered for each month.
- The YTD number for a given column should equal the total of all the current period data; so if January current period data is 5 and February is 8, then the YTD for February should be 13.
- The Goal is the YTD goal, which displays as dots along the dashed line in the graph. The goal line extends to the end of the year to show what the goal is for each month. The dots indicate the savings goal for each month, and the dark blue bars displays the actual savings for each month. Hover your cursor over the dots and bars to see the values for each.
- The numbers used in the chart come from the measure(s) in the MILESTONE/MEASURES tab of each Initiative.
NOTE: The bar chart displays a sum of the data from all included Initiatives. If the data represented in the graph looks incorrect, targets may not be set for all Initiatives, or some of the Initiatives may be missing other data. Ask your system administrator to run the appropriate data utilities if you have corrected missing data and the graph still looks incorrect.
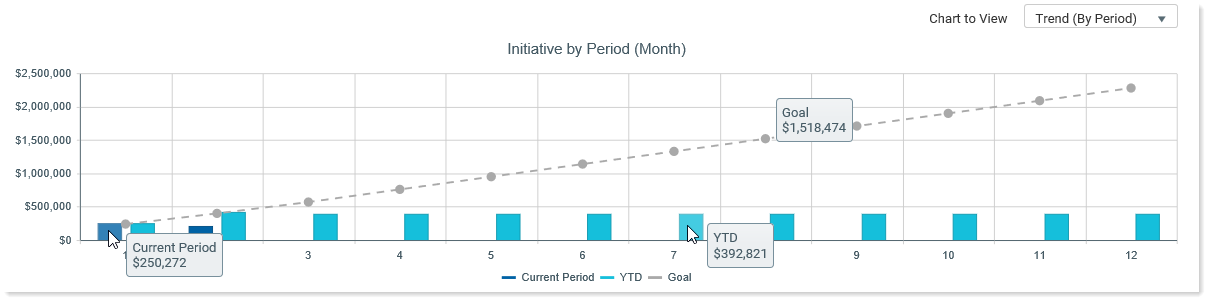
This example displays the moused-over cumulative savings for January. For each period that contains data, the light-blue year-to-date amount represents the sum of the current periods.
The By Group chart displays cumulative Initiative data by the group selected in the Second Chart - Group By section of the Filters panel and by either the Axiom Strategy Management Current Period or fiscal YTD.
As in the Trend chart, the dark blue bars represent cumulative current period savings for all Initiatives in the report, and the light blue bars indicate cumulative year-to-date savings.
For this chart, you can select to view only one block of time, either Current Period or fiscal Year-to-Date.
- Dots on each bar represent the savings target.
- The bar represents either the savings for the current period (dark blue) or the year-to-date savings (light blue).
- Time periods for the data come from the Axiom Strategy Management Current Period.
On the report, you can mouse over the target dots and bars to see the associated amounts.
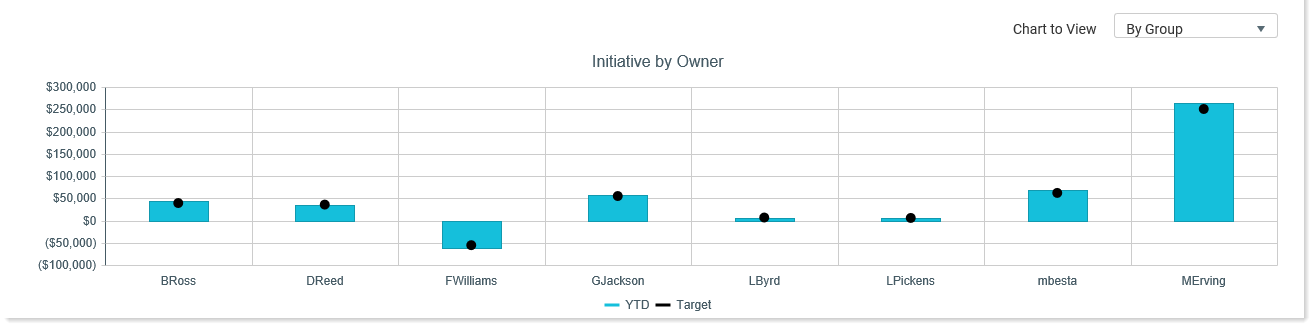
This example displays the year-to-date cumulative Initiative savings by Initiative owner.
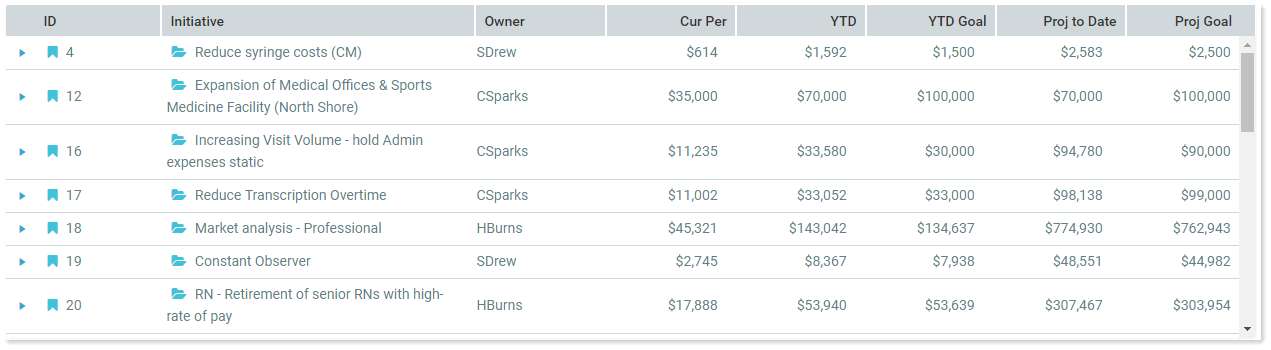
The report table displays a list of all filtered Initiatives, and displays the following measure data for each Initiative listed:
- Current period measure data value, year-to-date actual savings, year-to-date savings goal, project-to-date actual savings, and project-to-date goal
- From the drop-down for each Initiative:
Measure(s), department and entity (if specified), values for Current Period, year-to-date, year-to-date goal, Projected savings-to-date, and projected savings goal
Measure detail graph for each measure available from the row drop-down
Measure data is added together and presented as a single sum only if an Initiative has more than one cost-savings measure, as in the following example.
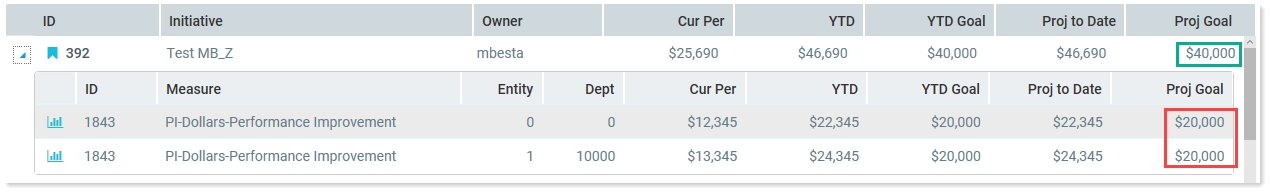
This example shows an Initiative with two cost-saving measures. The values for the two measures are summed to create the total values displayed in the top Initiative row.
