About Key Performance Indicator icons
Axiom Strategy Management displays Key Performance Indicator (KPI) icons to represent current status as compared with set targets and to show period-over-period trends. KPIs use measurements of active data to reflect whether the hierarchy item Perspective, Objective, or Initiative they apply to is performing favorably, unfavorably, or a mix of both, as compared to the target set in the item’s measure.
How the system determines KPI icon use
The system displays KPI icons to provide at-a-glance performance status for Perspectives, Objectives, and Initiatives. Perspective and Objective KPIs reflect their measure data. Initiatives are different in that their KPI icons represent the status of their milestones. For more information, see About Initiative milestones.
KPI icons represent a value judgment of whether the data measured is favorable or unfavorable compared to the target set in the measure when the measure is applied to a Perspective or Objective.
Measured data can be higher than, lower than, or right on the target. Whether data above the target or below the target is favorable or unfavorable depends on what is being measured. For example, when measuring profitability, data above the target is favorable. However, if the measure tracks the number of patient falls, then your target would be the maximum number of falls considered acceptable in a period, and a number at or below the target would be favorable. The direction of the data—above or below the target—that is favorable, is called the MeetsTargetDirection attribute. The MeetsTargetDirection attribute is defined when the measure is created.
In the following example, a Perspective measure tracks the AHRQ Patient Safety Indicator Composite for serious complications. For this measure, the MeetsTargetDirection is set to Lower. The target is set to the number 50. The current measurement is 47, which is lower than the set target, so the current measurement is favorable. The icon used to represent the measure’s current performance is called a performance icon. In this case, because the performance is favorable, the icon used is a check mark in a green circle.
Notice that the current measurement is lower than the prior measurement, which indicates improved performance over time. In Axiom Strategy Management, performance over time is called trend. When data is moving in a favorable direction from the previous measurement, the trend is favorable, which is represented by a green, up arrow icon.
![]()
Icons and icon colors indicate status: a check mark indicates favorable, an exclamation mark indicates unfavorable. Green represents favorable data, and red represents unfavorable data. Orange indicates the status is a mixture of favorable and unfavorable data if the icon is a performance icon. For a trend icon, orange indicates the trend is flat, meaning it is moving neither favorably nor unfavorably as compared to the previous frequency period measurement.
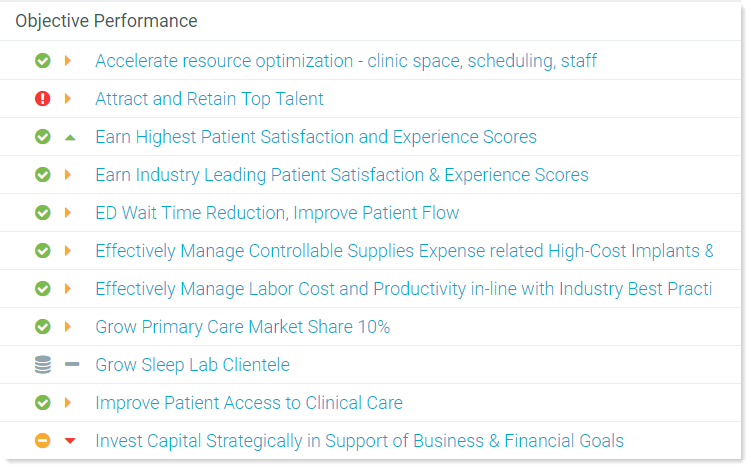
The following example of the list of Objectives from the Dashboard page displays each Objective’s KPI and trend icons.
For detailed descriptions of each icon used in the system, see the following tables.
Key Performance Indicator icons
Axiom Strategy Management uses two kinds of KPI icons: performance and trend. Performance icons come in two types: single-measure and roll-up measure. Single-measure icons reflect the status of a single measure, whereas roll-up measure icons reflect a combination of two or more measures.
This table lists the performance icons used for Perspective, Objective, and Initiative measures. Performance icons represent the status of measurements for a single frequency How often a measure's data is updated and reported. Frequency options are: monthly, quarterly, semi-annually, or annually. Frequency is set at the measure level. period.
| Icon | Meaning |
|---|---|

|
This icon indicates the hierarchy item’s measure is performing favorably compared to the set target The number used as a comparison point against which measure data is compared to determine if the measure data is favorable or unfavorable. The user assigning the measure to a Perspective, Objective, or Initiative, sets the target. The target typically comes from either a benchmarked or budgeted number.. The system displays this icon to represent the performance of a single measurement or multiple measurements that are performing favorably. |

|
This roll-up icon indicates that the hierarchy item’s measure performance is a mix of favorable and unfavorable measurements compared to the set target. This icon always represents a roll-up measurement A group of two or more measurements used to determine the status of the item being measured.. This icon also always represents a mix of favorable and unfavorable measurements for the item being measured, regardless of how many of the measurements are favorable or unfavorable. For example, if a Perspective has four measures and three of them are favorable and one is unfavorable, this performance icon is used; likewise, if three of the measures are unfavorable and one is favorable. |

|
This icon indicates that the item is performing unfavorably compared to the target. The system displays this icon to represent the performance of a single measurement or multiple measurements that are all performing unfavorably. |

|
This icon indicates that either no data is available for the item or that you do not have permissions to view that data. |
Trending is determined by comparing the measure value of the current frequency period to the previous frequency period. In the case of roll-up measures, this is evaluated by comparing the previous period performance (i.e. green, red, orange) to the current period performance. Trend icons apply only to measure data performance, not Initiative milestone performance.
| Icon | Meaning |
|---|---|

|
The item is trending favorably. This means the performance is headed in a favorable direction compared to the previous measurement. |

|
The item is trending flat. This means the performance is trending neither favorably nor unfavorably compared to the previous measurement. |

|
The item is trending unfavorably. This means the performance is headed in an unfavorable direction compared to the previous measurement. |

|
The item contains no data, or you do not have permissions to view the data. |
Icon combinations
The following table lists the possible performance-trend icon combinations and their meaning.
| Icon set | Meaning |
|---|---|

|
Performance is favorable compared to the target, and trending favorably compared to the previous measurement. |

|
Performance is favorable compared to the target, and trending flat, neither up nor down, compared to the previous measurement. |

|
Performance is currently favorable compared to the target, but trending unfavorably. |

|
Performance is a mixture of favorable and unfavorable measurements compared to the target, and is trending favorably compared to the previous measurement. |

|
Performance is a mixture of favorable and unfavorable measurements compared to the target, and is trending flat compared to the previous measurement. |

|
Performance is a mixture of favorable and unfavorable measurements compared to the target, and is trending unfavorably compared to the previous measurement. |

|
Performance is unfavorable compared to the target, and trending favorably compared to the previous measurement. |

|
Performance is unfavorable compared to the target, and trending flat compared to the previous measurement. |

|
Performance is unfavorable compared to the target, and trending unfavorably compared to the previous measurement. |

|
There is no performance or trend data available for the item, or you do not have permissions to view the data. |
