Working with the Manager Dashboard
The Manager Dashboard contains a series of interactive overview reports built specifically for people with certain kinds of organizational user roles: executive, operational, financial, and analyst. Using the dashboard, you can compare actual and forecast variance data by organizational performance, operational revenue and expense data, and financial summary information.
Opening the dashboard
Users must be assigned either the RF Admin, RF Analyst, or RF User role to use the dashboard.
To open the dashboard:
In the RF Admin or Rolling Fcsting task pane, under Reporting, double-click Manager Dashboard.
Using the dashboard
IMPORTANT: Before using the dashboard, ensure the following:
1. Any recent changes made in the Dashboard Configuration Utility have been saved.
2. Actuals from the desired fiscal year(s) have been loaded.
3. Plan files have been created and processed.
The Manager Dashboard is comprised of the following areas:
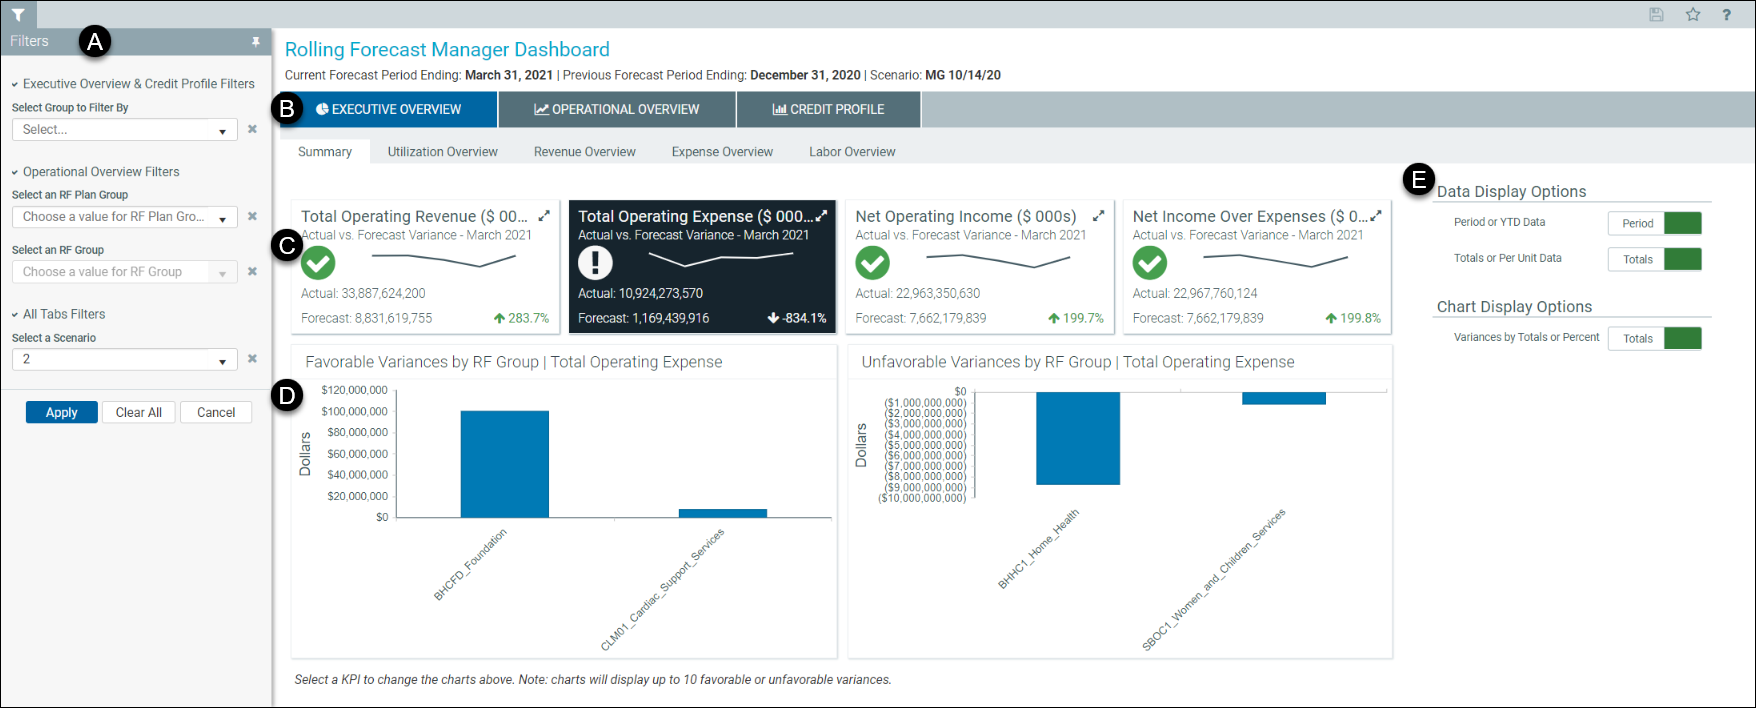
 Filters
Use the options on the Filters panel to control the type and source of data displayed in the report for the various tabs. The first two sections in the panel apply to the Executive Overview and the Credit Profile tabs. The middle section applies to data in the Operational Overview tab. The selected scenario applies to all data in all tabs.
In the Filters panel:
- Under Executive Overview and Credit Profile Filters, select the group and related subfilter to filter by.
-
Under Operational Overview filters, select the RF Plan Group and a related RF Group.
IMPORTANT: Selecting an RF Plan Group and an RF Group are required for the Operational Overview tab.
- Under All Tabs Filters, select a scenario.
- Click Apply.
To make changes to existing selections:
- To clear a single filter option, click the x next to the drop-down.
- To clear all the filter options, click Clear All.
The filter criteria detail you select display above the tabs:

 Tabs
Tabs
Report data is divided into three main sections based on the data that users with certain roles would be most likely to need:
-
Executive Overview – Displays summary-level data and other overview-level data of your organization’s performance. Subtabs provide summary, utilization, revenue, expense, and labor data.
NOTES:
- The Executive Overview tab does not display data if there is no prior forecast period to compare current data to, and the Data Display Options setting in the Rolling Forecasting Manager Dashboard Settings utility is set to Period instead of YTD data. If there are less than two forecast periods that contain data (includes the current period), then the following message displays: “This dashboard will become active when you have at least two periods of data to compare.”
- For all subtabs, when the Totals or Per Unit Data setting in Data Display Options is set to Per Unit, Historical Performance Analysis data is not available. When the Totals Per Unit Data setting is set to Totals, Historical Performance Analysis data is available, with two exceptions: the Net Income over Expenses KPI card on the Summary tab and the Paid Hours per Unit KPI card on the Labor Overview tab do not have historical analysis data regardless of the selection in the Data Display Options’ Totals per Unit Data setting.
- Operational Overview – Displays revenue and expense data related to your organization’s operations. Subtabs provide KPI data, patient revenue, other revenue, labor, benefits, and other expenses data.
- Credit Profile tab – Displays financial summary information, margins, and asset liquidity. Subtabs provide fiscal summary, profitability, and liquidity data.
 Statistics cards, and Key Performance Indicators (KPIs), and tables
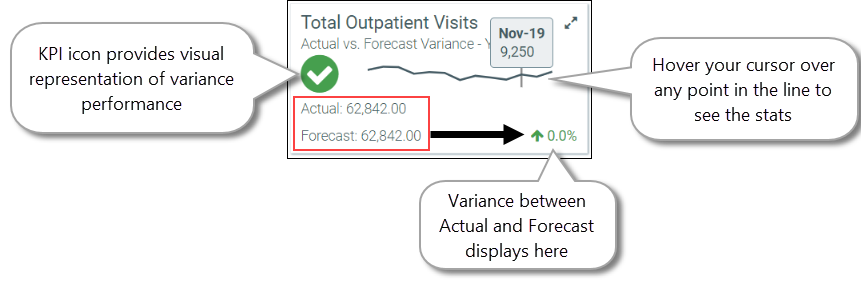
The Executive Overview and Operational Overview tab reports have statistics cards at the top of each subtab.
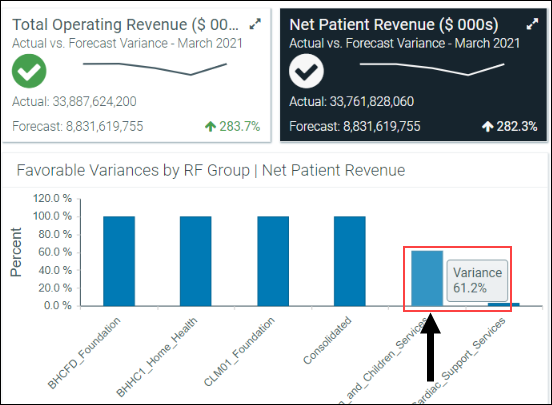
- In the Executive Overview tabs, the statistics cards display the dollar or percent variance between actual and forecast data for each card’s given metric, plus a mini trend graph and KPI icon.
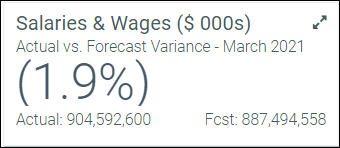
-
In the Operational Overview tabs, the statistics cards display the actual and forecast amounts, with the variance in large font. Negative variance amounts are enclosed in parentheses:
-
Some cards provide additional historical performance data in a table. To view historical performance analysis, in the upper right corner of a card, click the show more icon (
 ):
):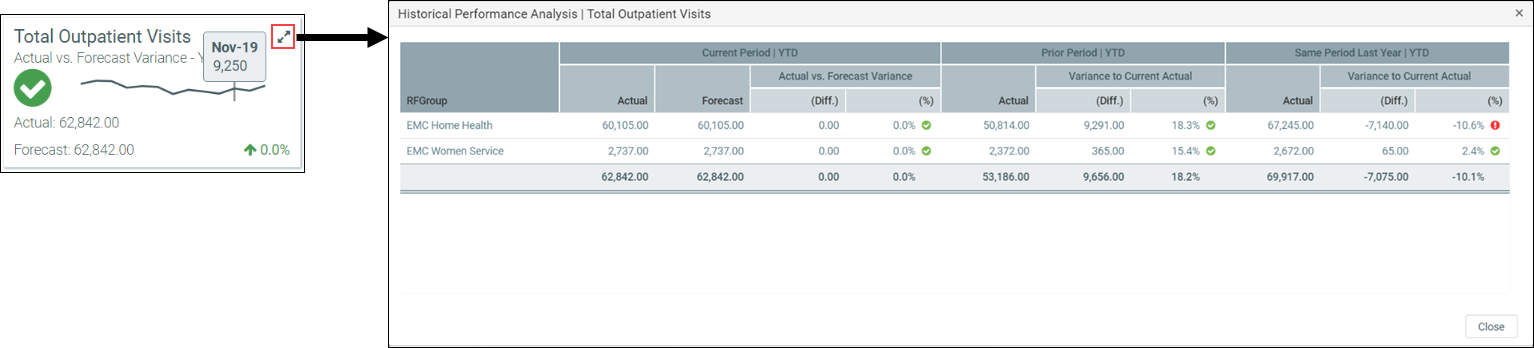
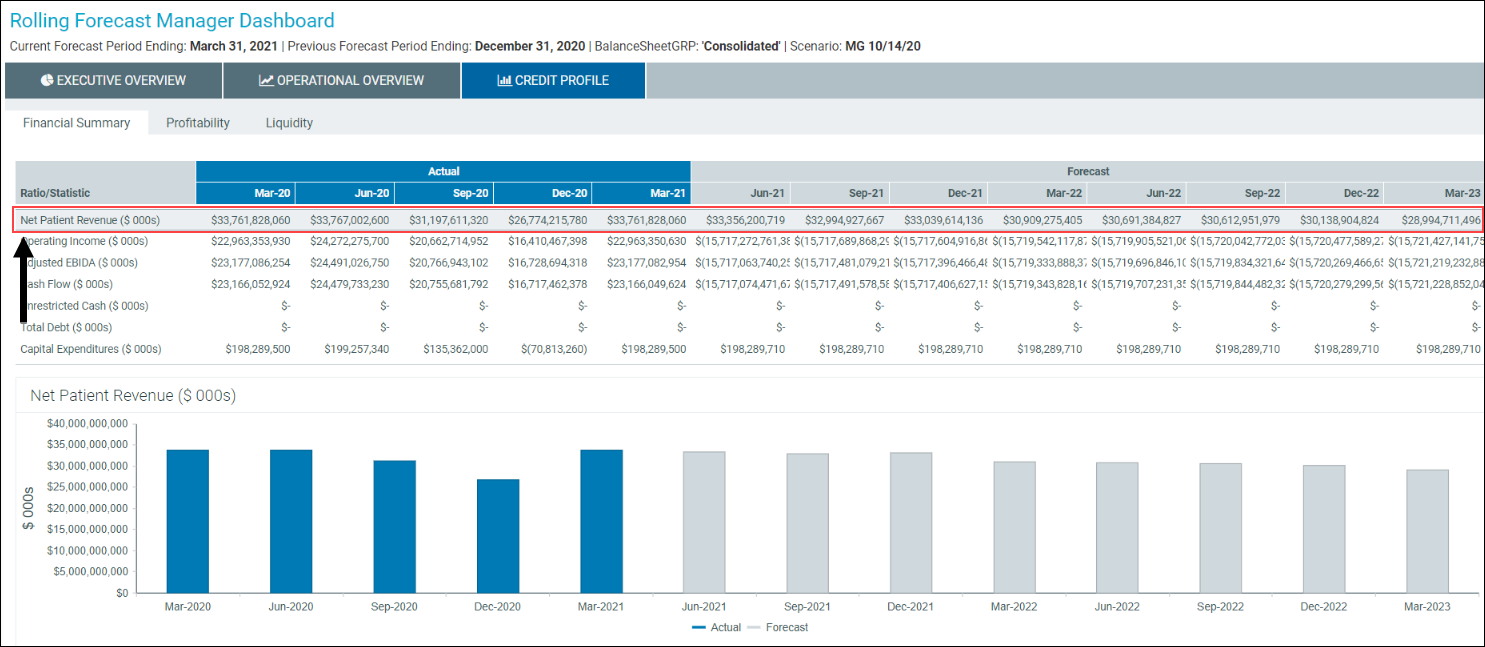
-
The Credit Profile tab reports display data in table rows instead of status cards. Click a table row to view the data displayed as a bar chart. The following example shows the selected row represented in the bar chart.
 Charts
In Executive Overview and Operational Overview reports, charts display variances in a graph for the selected statistics card (exception: Operational Overview’s KPIs tab cards). Selected cards display with a black background.
-
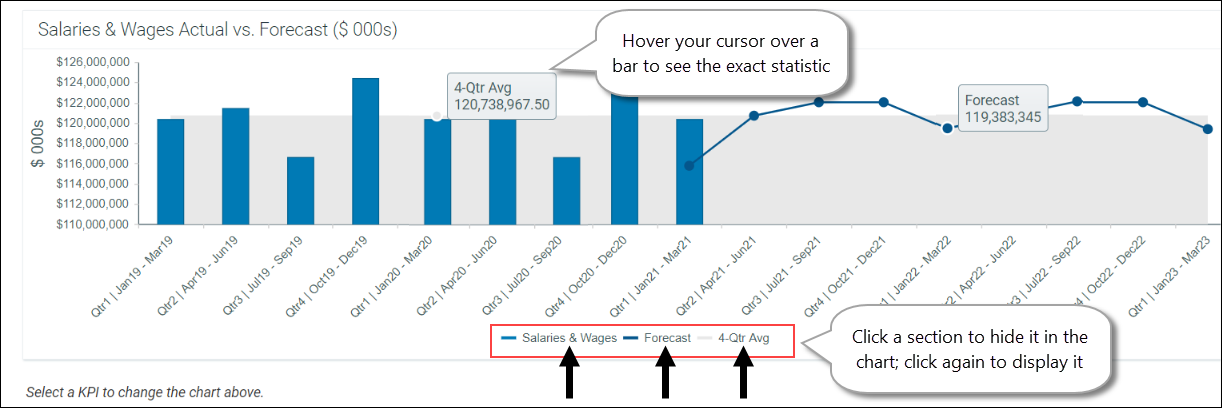
Hover your cursor over a bar in the graph to see the exact variance amount for that bar:
-
In Operational Overview charts, you can select to hide the different metrics displayed: the bar graph, which displays actuals; the line graph, which displays forecasts; or the gray shading behind both that represents a 3-month or quarterly average, depending on whether you are set up for forecasting monthly or quarterly.
-
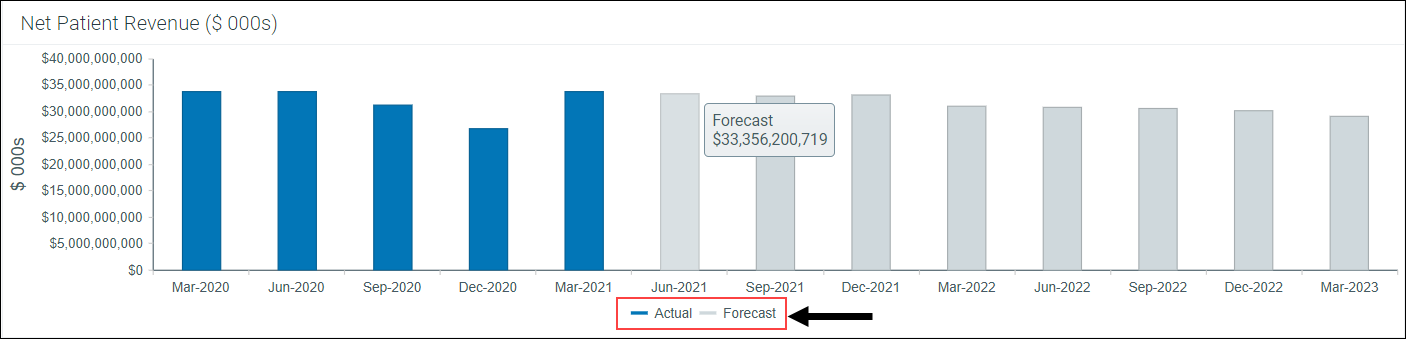
Credit Profile charts display only actual and forecast data in a bar graph. You can toggle the blue actual bars and the gray forecast bars on and off in the display, and like the other charts, hovering your cursor over a graph bar displays the amount:
 Data and chart controls
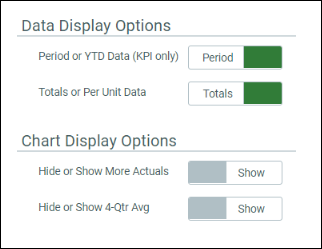
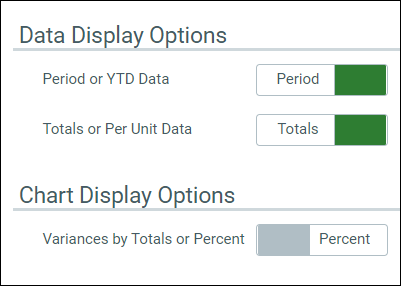
The Executive Overview and Operational Overview tabs have display controls on the right side of the page that control the time period and units used for calculations. To change the period or units displays, click the corresponding toggle button.
-
Executive Overview display options:
-
Operational Overview display options: