Using the Management Reporting Variance Analysis report
The Management Reporting Variance Analysis report allows you to compare operating revenue, income, and expenses from Axiom Financial Planning, Axiom Budgeting, and Axiom Rolling Forecasting for a selected Axiom Financial Planning File Group year. You can also use the report to compare Axiom Financial Planning data and data from one of the other two products, if desired, or if your Axiom Financial Planning system is not integrated with both Axiom Budgeting and Axiom Rolling Forecasting.
You can use this report as a comparison tool to compare a selected year between Axiom Financial Planning, Axiom Budgeting, and Axiom Rolling Forecasting. This can be used to compare performance to the target set in Axiom Financial Planning.
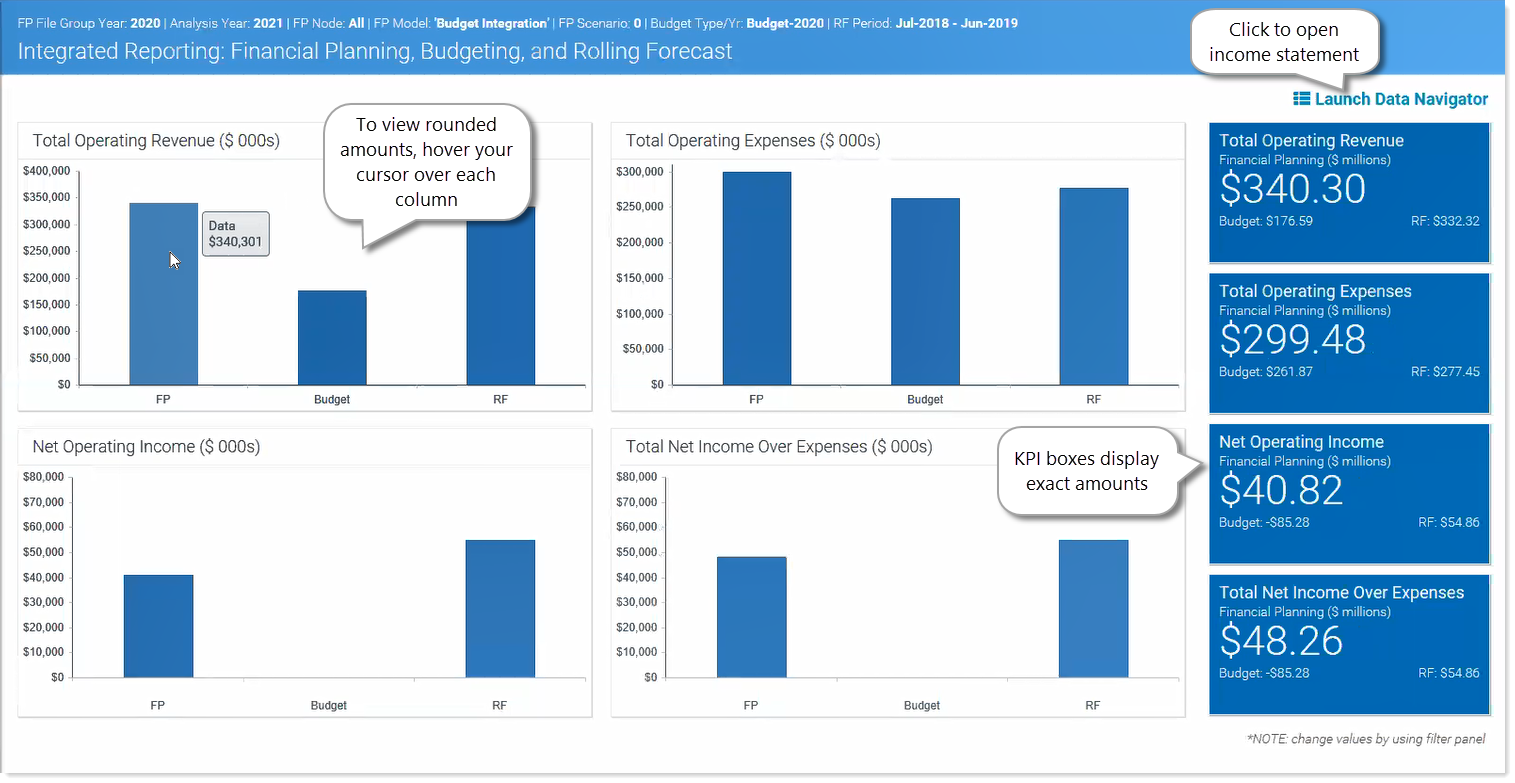
The Management Reporting Variance Analysis report has two parts: a set of graphs and an income statement.
The graphs display the following Key Performance Indicators:
- Total operating revenue
- Total operating expenses
- Net operating income
- Total net income over expenses
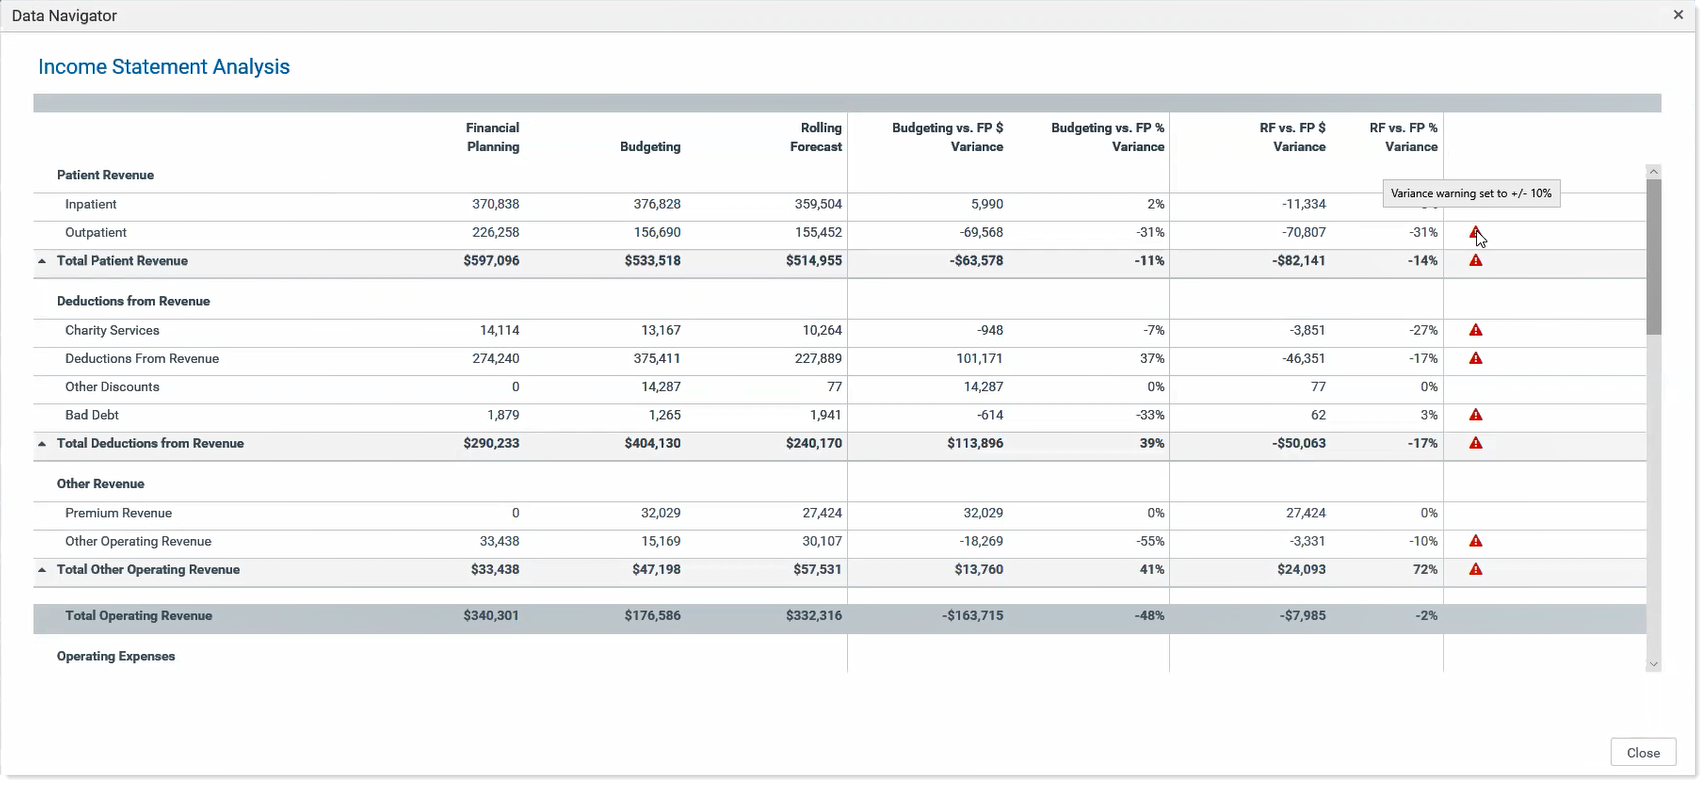
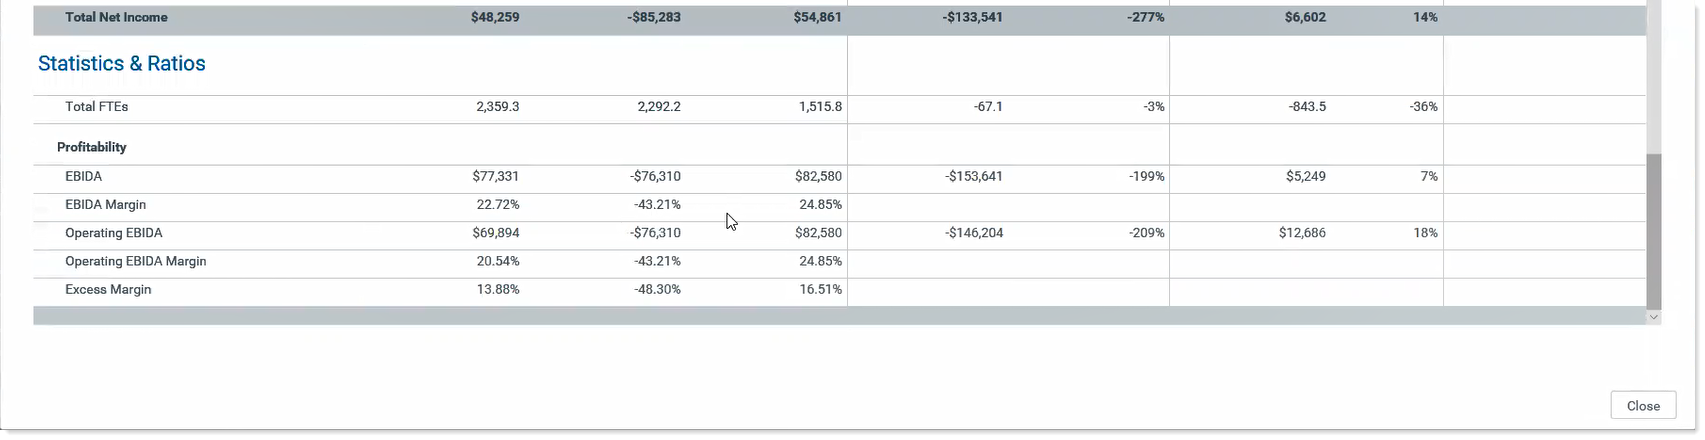
The income statement displays an analysis section followed by a Statistics and Ratios section:
Statistics and Ratios section:
To use the report:
-
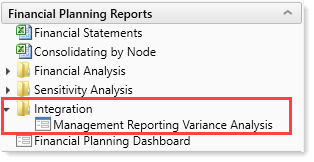
In the Fin Plan Admin task pane, in the Financial Planning Reports section, expand the Integration folder and then double-click Management Reporting Variance Analysis.
-
To filter the data in the report, click the funnel icon in the upper left corner of the report.
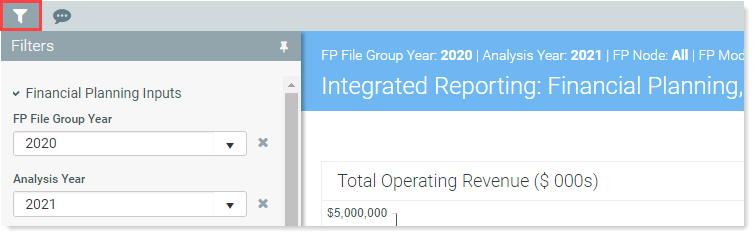
-
Select from the following filter options, as needed:
Filter Option Description Financial Planning Inputs Select the data from Financial Planning to use. FP File Group Year Select the FP File Group year to compare. Analysis Year Select the year to analyze and set budget targets. FP Node (from DEPT table) (optional) Select the FP Node used as the link between the integrated products in the report. This data comes from the mapping column in the DEPT table that maps the Financial Planning and Department together. Model (optional) Select the model, if desired. Scenario Select the scenario. For more information, see Working with Scenarios and Create, modify, or copy a scenario. Budgeting Inputs Select the data from Management Reporting table to use in your analysis. Budget Type/Year
Select the desired Budget-[year], Actual-[year], or Current Year Forecast-[year] Rolling Forecasting Inputs Select the data to use from Rolling Forecasting. Rolling Forecasting Period 1
Select the desired quarter to use as the first quarter in your analysis year. Rolling Forecasting Period 2
Select the desired quarter to use as the second quarter in your analysis year. Rolling Forecasting Period 3
Select the desired quarter to use as the third quarter in your analysis year. Rolling Forecasting Period 4
Select the desired quarter to use as the fourth quarter in your analysis year. - Click Apply.
- To launch the income statement, in the upper right of the report, click Launch Data Navigator.
