Using the Financial Planning Dashboard
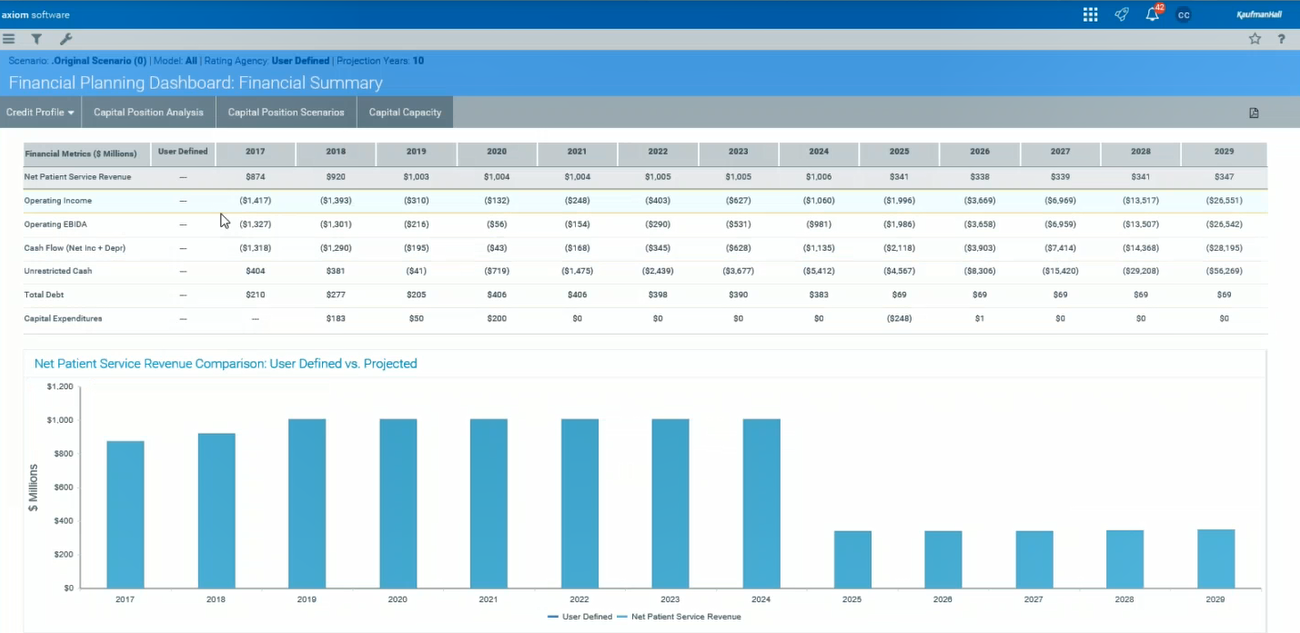
The Financial Planning Dashboard provides a web-based version of the Capital tab in the Financial Statements report. The Dashboard displays the following data:
- Credit Profile – Common financial metrics used for analysis by rating agencies
- Financial Summary – Selected profitability and capital metrics
- Profitability – Annual Operating Margin, Operating EBIDA Margin, and Excess Margin grid and graph, compared to selected rating median
- Debt Position – Annual debt service coverage, debt to capitalization, and debt to cash flow grid and graph compared to selected rating median
- Liquidity – Annual cash to debt, days cash, and days in AR grid and graph compared to selected rating median
Other Financials – Average age of plant, capital spending ratio, and compensation ratio grid and graph compared to selected rating median
-
Capital Position Analysis – Sources and uses of cash analysis for selected number of years. Allows entry of other additional sources and uses of cash as well as bond funds and displays cash flow requirements and historical cash flow
-
Capital Position Scenarios – Annual cash flow requirements for incremental days cash on hand values with the option to change days cash on hand values and increment baseline cash values
-
Capital Capacity – Estimated debt capacity, long-term debt, existing cash, minimum cash target, net cash position, and net capital capacity grid and graph
To use the Financial Planning Dashboard:
-
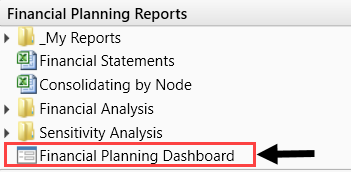
In the Fin Plan Admin task pane, in the Financial Planning Reports section, double-click Financial Planning Dashboard.
-
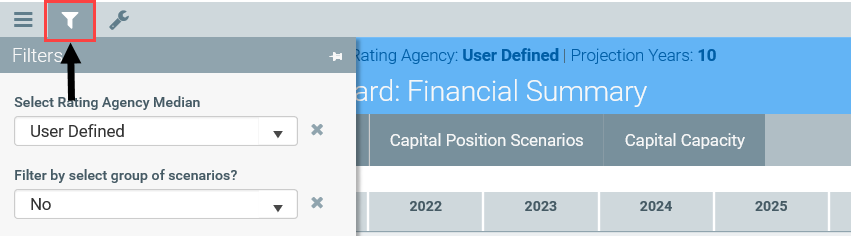
To filter the data for the dashboard, click the funnel icon in the upper left corner of the page.
-
Select the following filter options, as needed:
Option Description Select Rating Agency Median Select the rating agency to use.
NOTE: By default, the system uses the rating agency median defined in the Setup driver.
Filter by select group of scenarios? To filter by a group of scenarios, select Yes.
NOTE: If you select Yes, the Select a SCENARIO.RptScenario Group drop-down displays. Select the scenario group from this drop-down.
Select a MODEL Select one or more models. Select a SCENARIO Select one or more scenarios. No. of Projection Years Select the number of years. Advanced Filters Use the Filter Wizard to create or use an existing filter. - Click Apply.
