Product profitability dashboard
Use the Product profitability dashboard to evaluate the products you offer and their profitability for your institution. Information is presented in visual, graphic, and tabular formats. While each tab opens in a standard view, you'll find numerous controls that enable you to view the precise data at the level you need. Data can be exported, if needed. See Axiom Intelligence dashboards for information about basic techniques and tools for dashboards.
This dashboard has four tabs, each presenting different views of product profitability data.
Visual tab
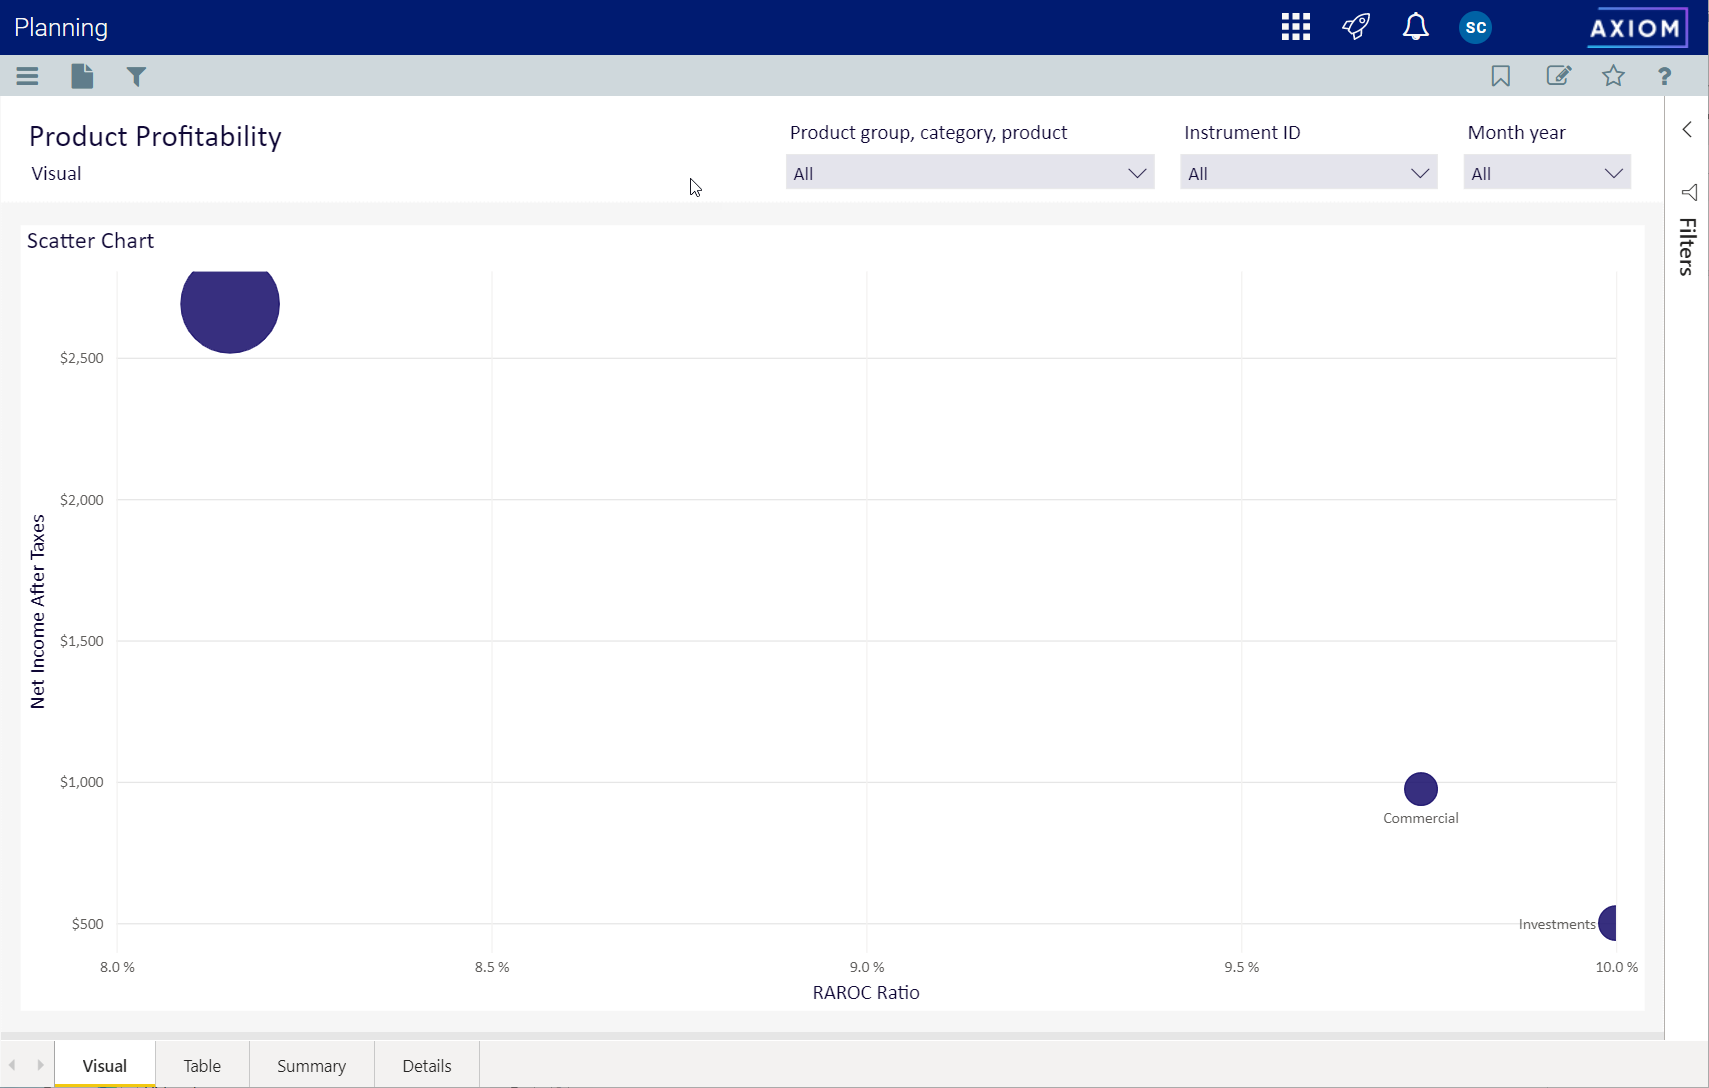
This tab uses a scatter chart to show profitability for products that you designate.
Click image to view full size
This table describes the options for choosing the data you want to analyze.
| Control | Description and Options |
|---|---|
| Product group, category, product |
You can select one or more product groups. You can also select categories within a group or products within a category. The default setting is all product groups. |
| Instrument ID | You can select one or more individual instrument IDs. The default setting is all instrument IDs associated with the choices made in the product group, category, product selector. The default setting is all product groups. |
| Month Year | You can select one or more months of data to view or view all dates. |
Right-click on an item in the chart to use options to drill down, drill up, show as a table, include, or exclude the item from the visualization.
Table tab
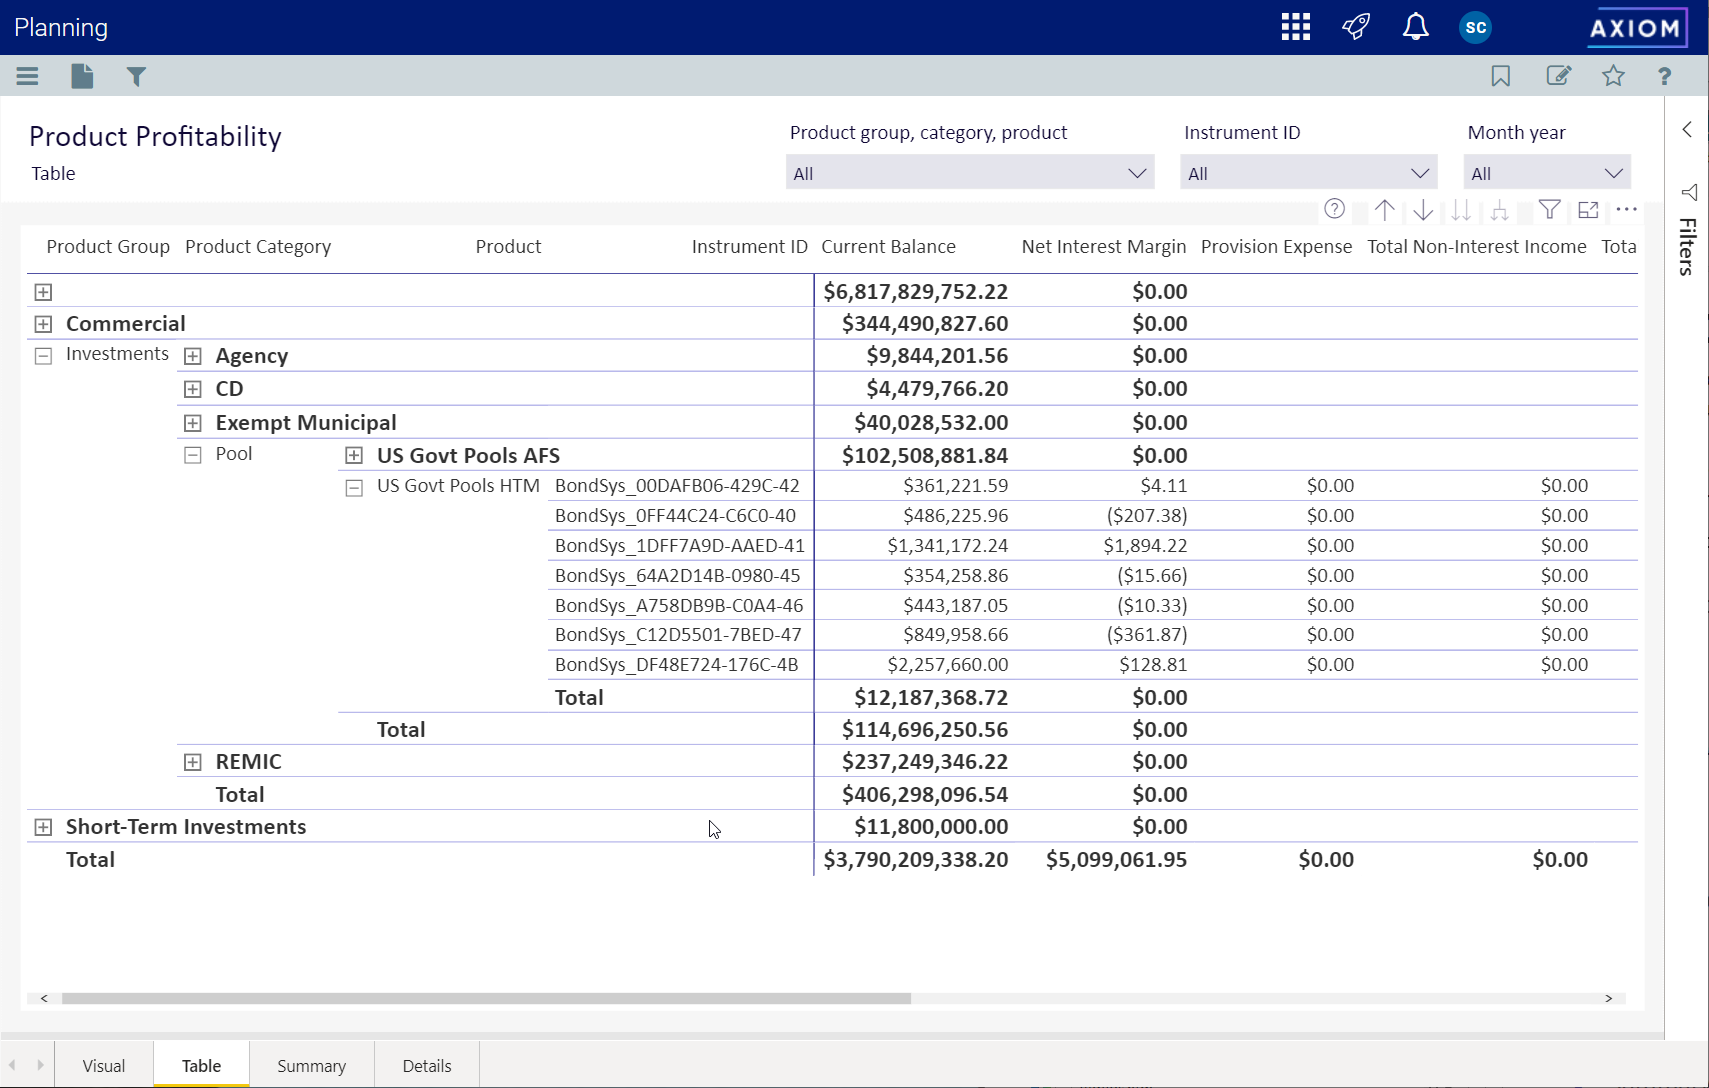
This table shows information about your products and their profitability. You can view data by product group, product category, product, and instrument ID.
Click image to view full size
This table describes the options for choosing the data you want to analyze.
| Control | Description and Options |
|---|---|
| Product group, category, product |
You can select one or more product groups. You can also select categories within a group or products within a category. The default setting is all product groups. |
| Instrument ID | You can select one or more individual instrument IDs. The default setting is all instrument IDs associated with the choices made in the product group, category, product selector. The default setting is all product groups. |
| Month Year | You can select one or more months of data to view or view all dates. |
Click image to view full size
Summary tab
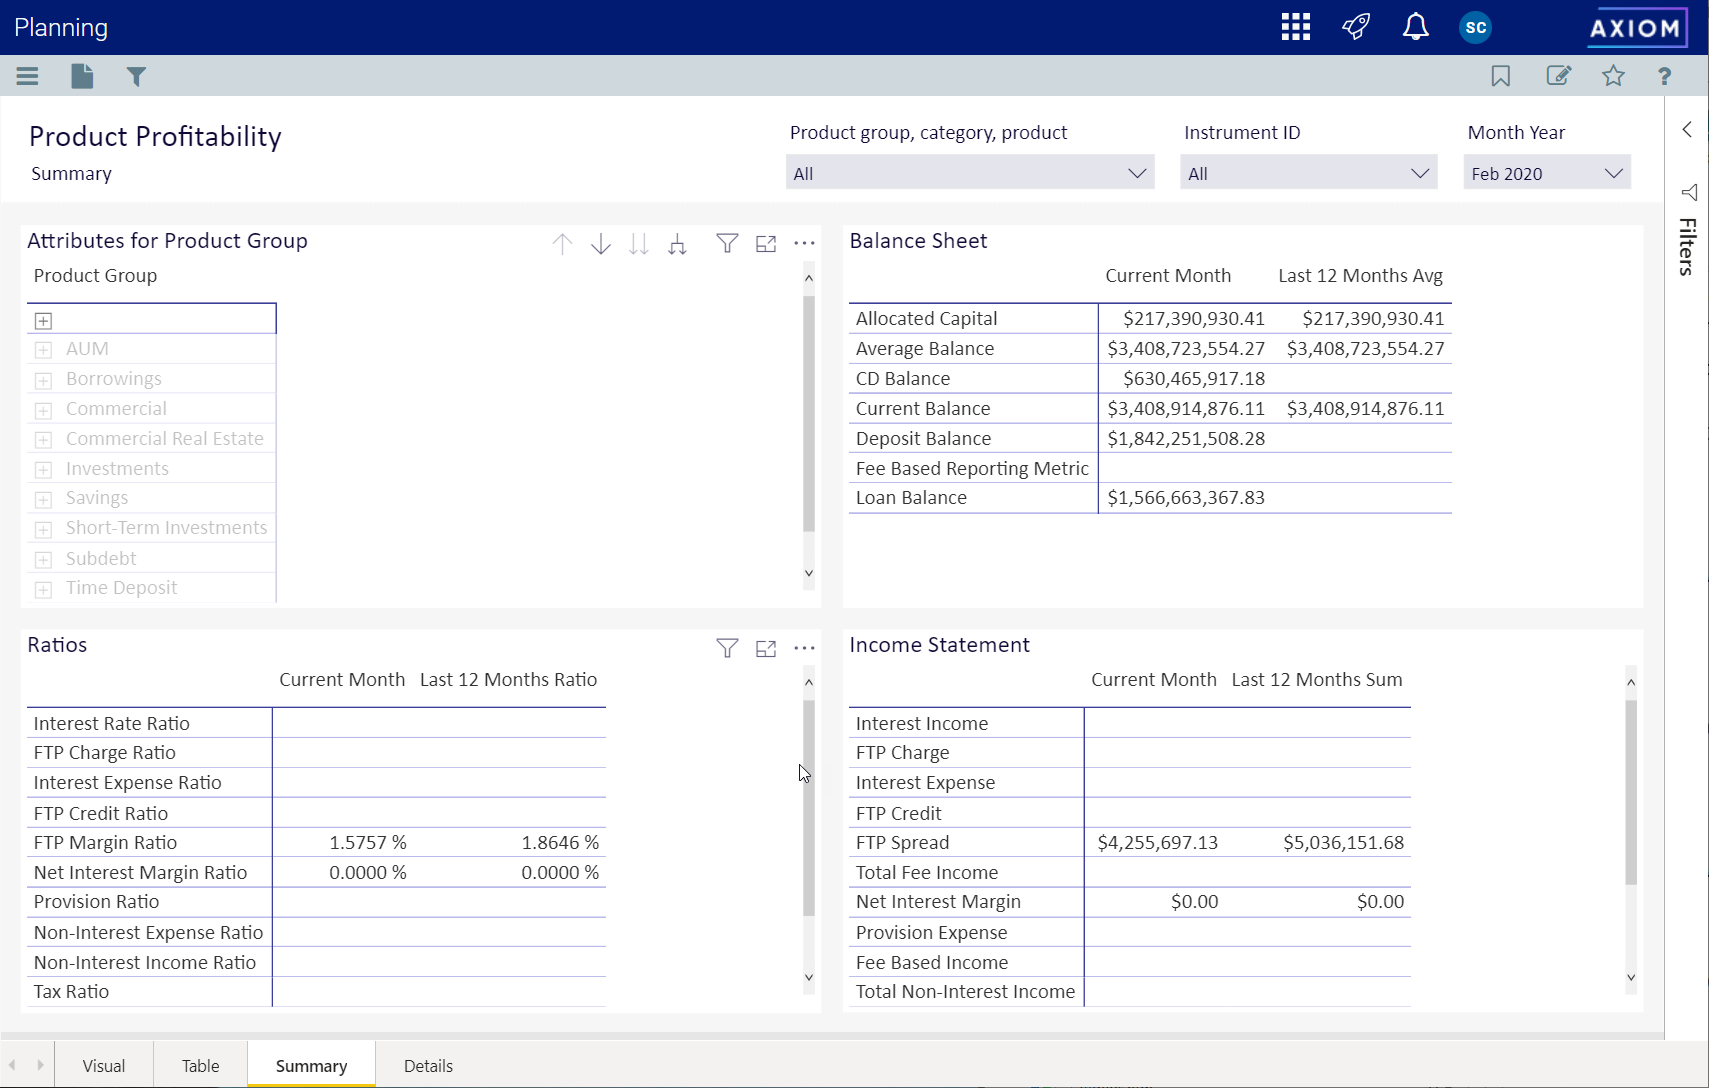
This page consists of four panel containing summary information about attributes for product groups, balance sheet, ratios, and income statements.
Click image to view full size
This table describes the options for choosing the data you want to analyze.
| Control | Description and Options |
|---|---|
| Product group, category, product |
You can select one or more product groups. You can also select categories within a group or products within a category. The default setting is all product groups. |
| Instrument ID | You can select one or more individual instrument IDs. The default setting is all instrument IDs associated with the choices made in the product group, category, product selector. The default setting is all product groups. |
| Month Year | You can select one or more months of data to view or view all dates. |
Attributes for Product Group
Use this pane to select the product group, product category, or product that you want to view data for. Click on a + plus mark to expand the view.
Balance Sheet
The Balance Sheet pane shows the current month and the monthly average over the last 12 months for the group, category or product you selected. The Axiom Intelligence BI tool let you export data, show as table, and sort by item.
Ratios
The Ratios pane lists different types of ratios, showing percentages for various types for the current month as well as the ratio for the last 12 months.
Income Statement
The Income Statement pane breaks down the income from the group, category, or product you selected. It shows income for the current month and the sum of the last 12 months.
Details tab
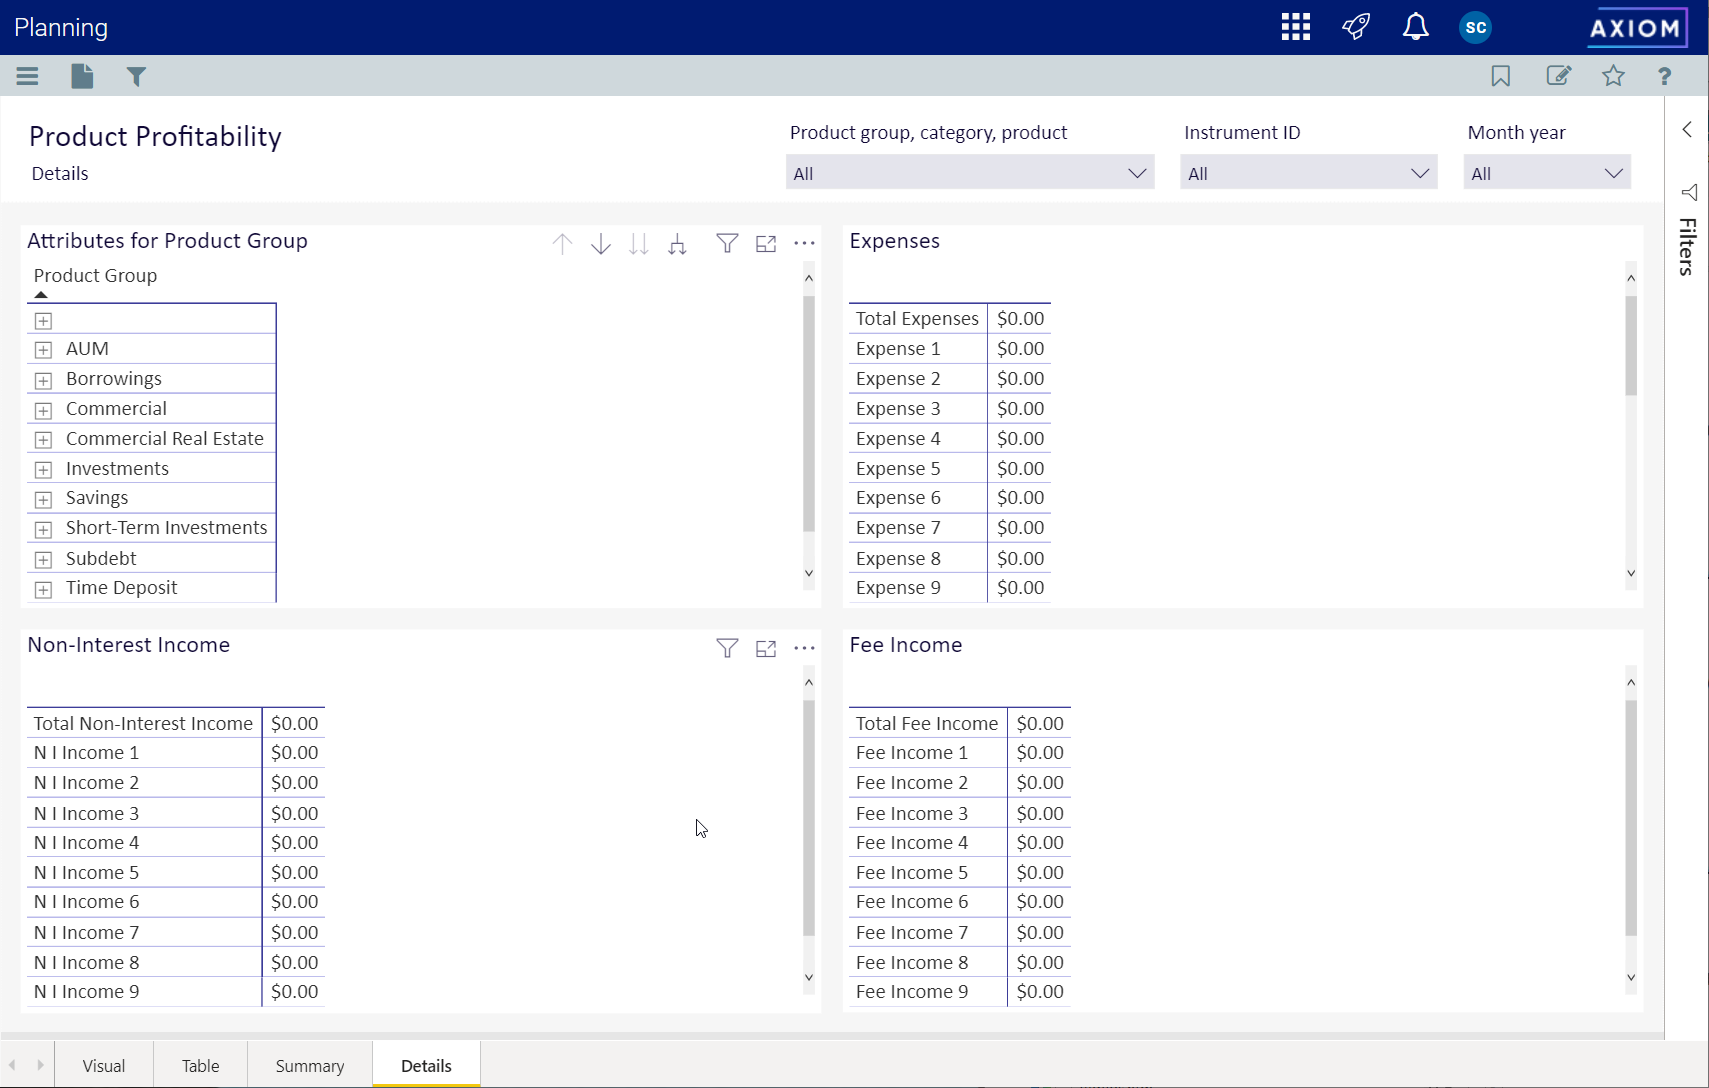
This page shows expenses, non-interest income, and fee income for the product group, product category, or product you want to view.
Click image to view full size
This table describes the options for choosing the data you want to analyze.
| Control | Description and Options |
|---|---|
| Product group, category, product |
You can select one or more product groups. You can also select categories within a group or products within a category. The default setting is all product groups. |
| Instrument ID | You can select one or more individual instrument IDs. The default setting is all instrument IDs associated with the choices made in the product group, category, product selector. The default setting is all product groups. |
| Month Year | You can select one or more months of data to view or view all dates. |
Use the Attributes for Product Group pane to select a group, category, or product to view data about. Click a + mark to expand and view options.
Click image to view full size
View expenses, non-interest income, and fee income for your selection in additional panes.
