Customer and Product Profitability dashboards
Use the Customer Profitability dashboard to evaluate customers as to their profitability for your institution. Information is presented in visual, graphic, and tabular formats. While each tab opens in a standard view, you'll find numerous controls that enable you to view the precise data at the level you need. Data can be exported, if needed. See Axiom Intelligence dashboards for information about basic techniques and tools for dashboards.
This dashboard has five tabs, each presenting different views of customer profitability data.
Visual tab
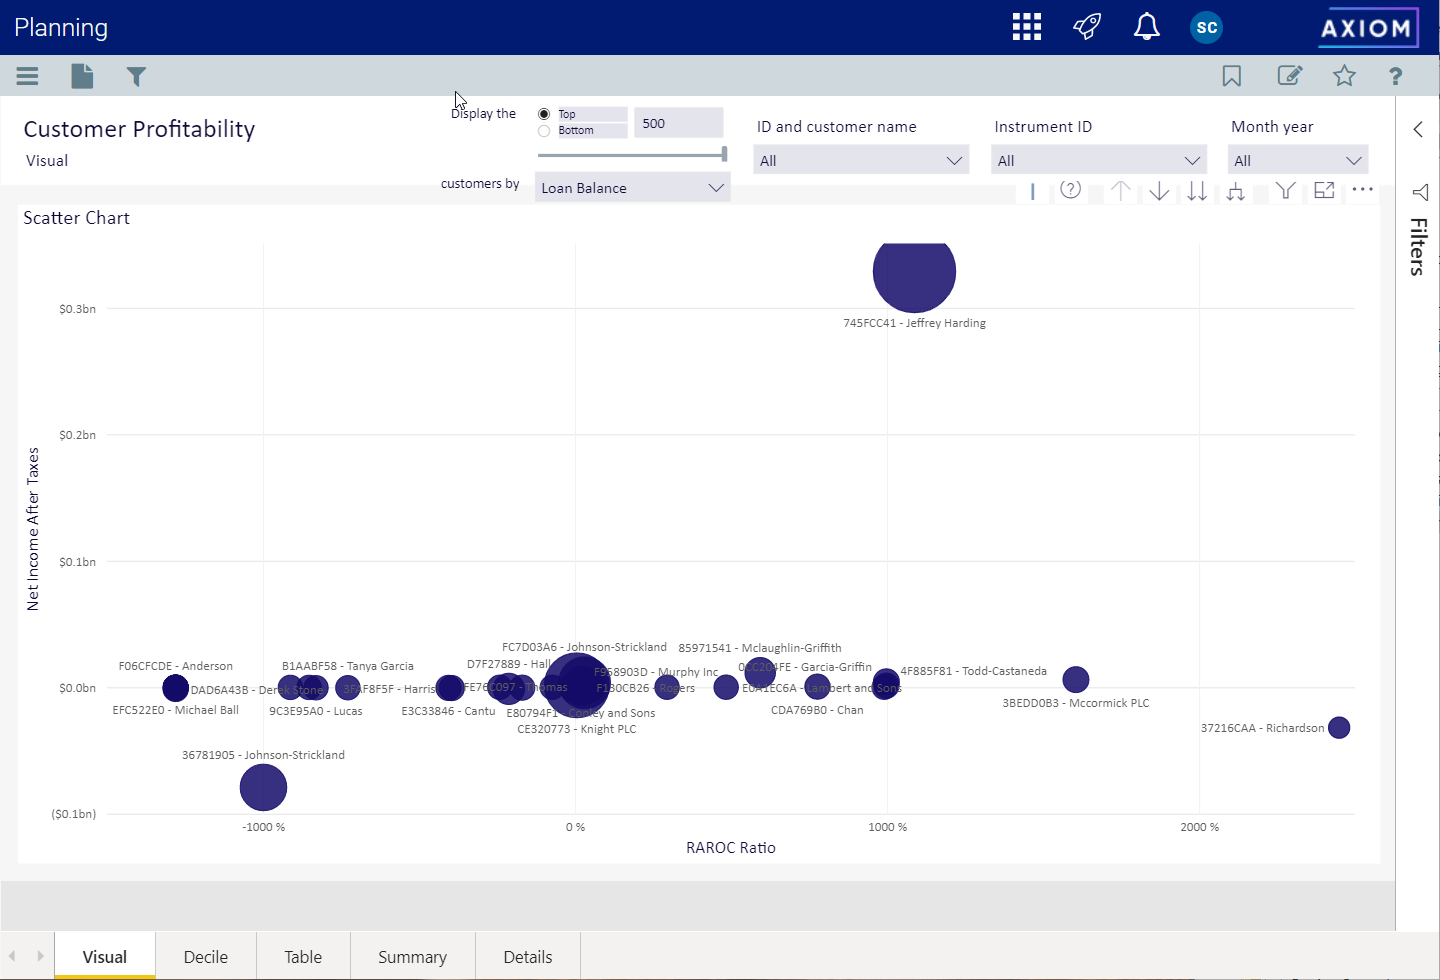
This tab uses a scatter chart to show profitability for a range customers that you designate.
Click image to view full size
This view is laid out in an x-y axis, where x is the RAROC ratio and y is net income after taxes.
| Control | Description and Options |
|---|---|
| Display the |
The options buttons let you view either top or bottom customers according to profitability. You can define the number of customers to include in the view. The default setting is 500. |
| Customers by | You can view the customer set you defined by Deposit Balance, Instrument Count, Loan Balance, Net Income After Taxes, and RAROC, |
| ID and customer name | Customers are shown with a name and customer ID. You can view bubbles for all of the customer set you define or use this control to select one or more customers to view. |
| Instrument ID | By default, profitability is calculated using all of the instruments they have. You can select one or more instrument IDs to view profitability by just those instruments. |
| Month year | The default setting is for all months and years the customer has been with your institution. You can, however, select specific months and years for your evaluation. |
Right-click your mouse to reveal additional viewing options, such as adding a table view to the dashboard and viewing different levels.
Standard filter tools in the upper right corner of the dashboard let you drill down through instruments, view filters, and export data. The Sort by option, accessed by clicking the ellipsis icon, lets you change how the table is sorted by letting your choose which column you want to sort by.
Decile tab
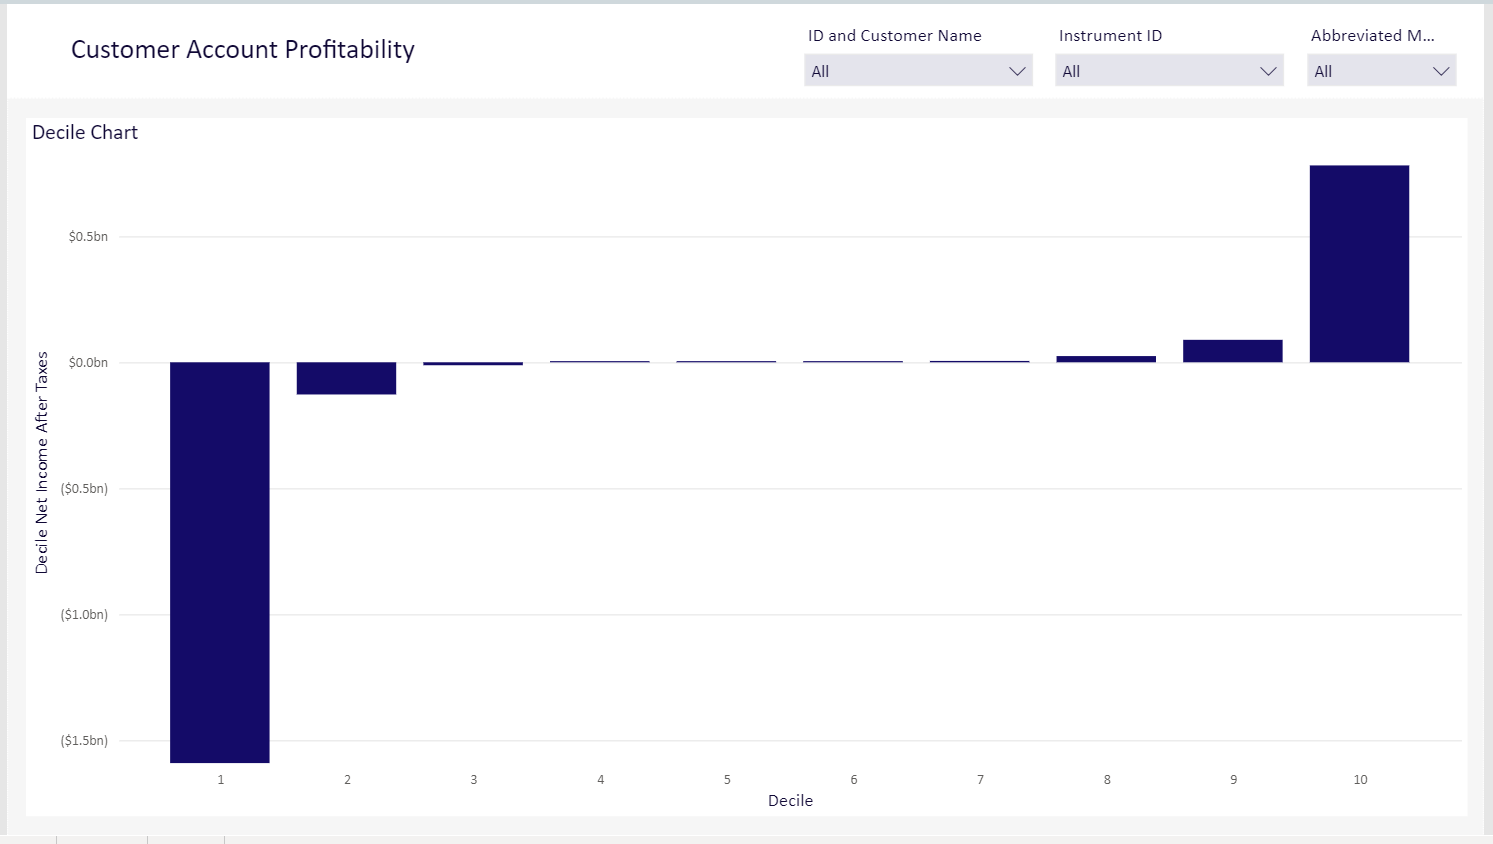
This report uses a bar chart format to plot customer profitability. Decile is a quantitative method of splitting up a set of ranked data into 10 equally large subsections. In this report, each subsection represents a half-billion dollars. it uses baseline of zero, where some customers are below a zero billion and others are above a zero billion.
Click image to view full size
Report options include:
| Control | Description and Options |
|---|---|
| ID and customer name | Customers are shown with a name and customer ID. You can view bubbles for all of the customer set you define or use this control to select one or more customers to view. |
| Instrument ID | By default, profitability is calculated using all of the instruments they have. You can select one or more instrument IDs to view profitability by just those instruments. |
| Abbreviated Month year | The default setting is for all months and years the customer has been with your institution. You can, however, select specific months and years for your evaluation. |
Right-click your mouse to choose the option to show the data as table.
Table tab
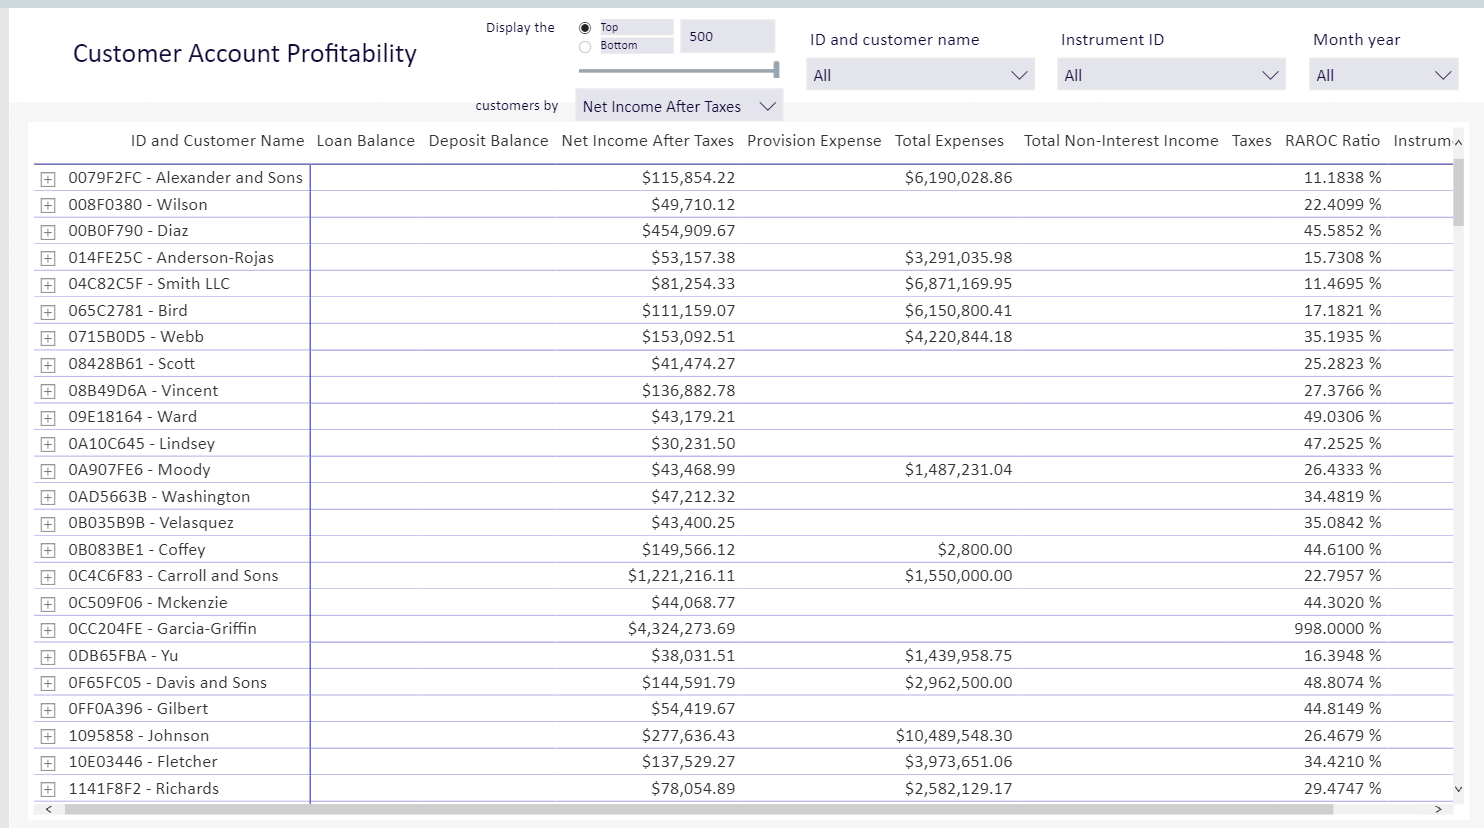
This table lists customers according to profitability according to your specification. The report is a tabular representation of the data shown on Visual tab, but with a richer set of controls for examining customers in great detail.
Click image to view full size
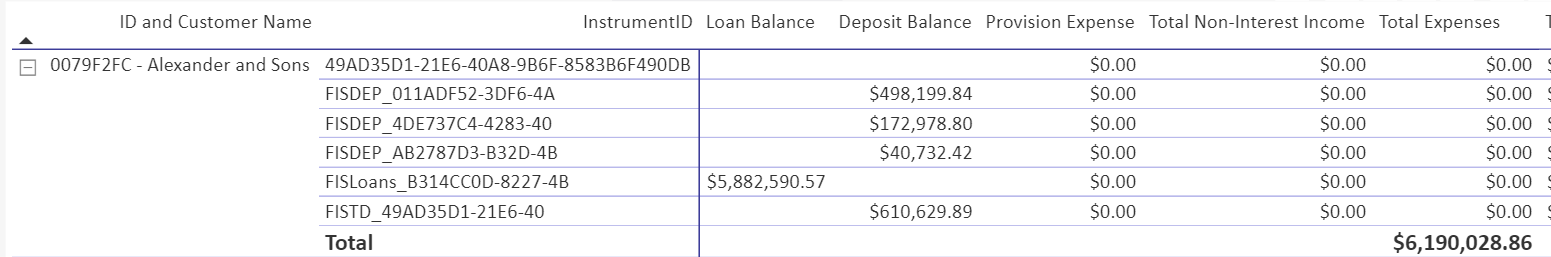
Click the + mark next to the customer name to see details for each of the instruments associated with that customer:
Report options include:
| Control | Description and Options |
|---|---|
| Display the |
The options buttons let you view either top or bottom customers according to profitability. You can define the number of customers to include in the view. The default setting is 500. |
| Customers by | You can view the customer set you defined by Deposit Balance, Instrument Count, Loan Balance, Net Income After Taxes, and RAROC, |
| ID and customer name | Customers are shown with a name and customer ID. You can view bubbles for all of the customer set you define or use this control to select one or more customers to view. |
| Instrument ID | By default, profitability is calculated using all of the instruments they have. You can select one or more instrument IDs to view profitability by just those instruments. |
| Month year | The default setting is for all months and years the customer has been with your institution. You can, however, select specific months and years for your evaluation. |
Additional tools let you drill through instrument data and view filters. The sort by option, accessed by clicking on the ellipsis icon, lets you sort the table on any of its columns.
Summary tab
This report contains four panes for examining profitability: Attributes, Ratios, Balance Sheet, and Income Statement.
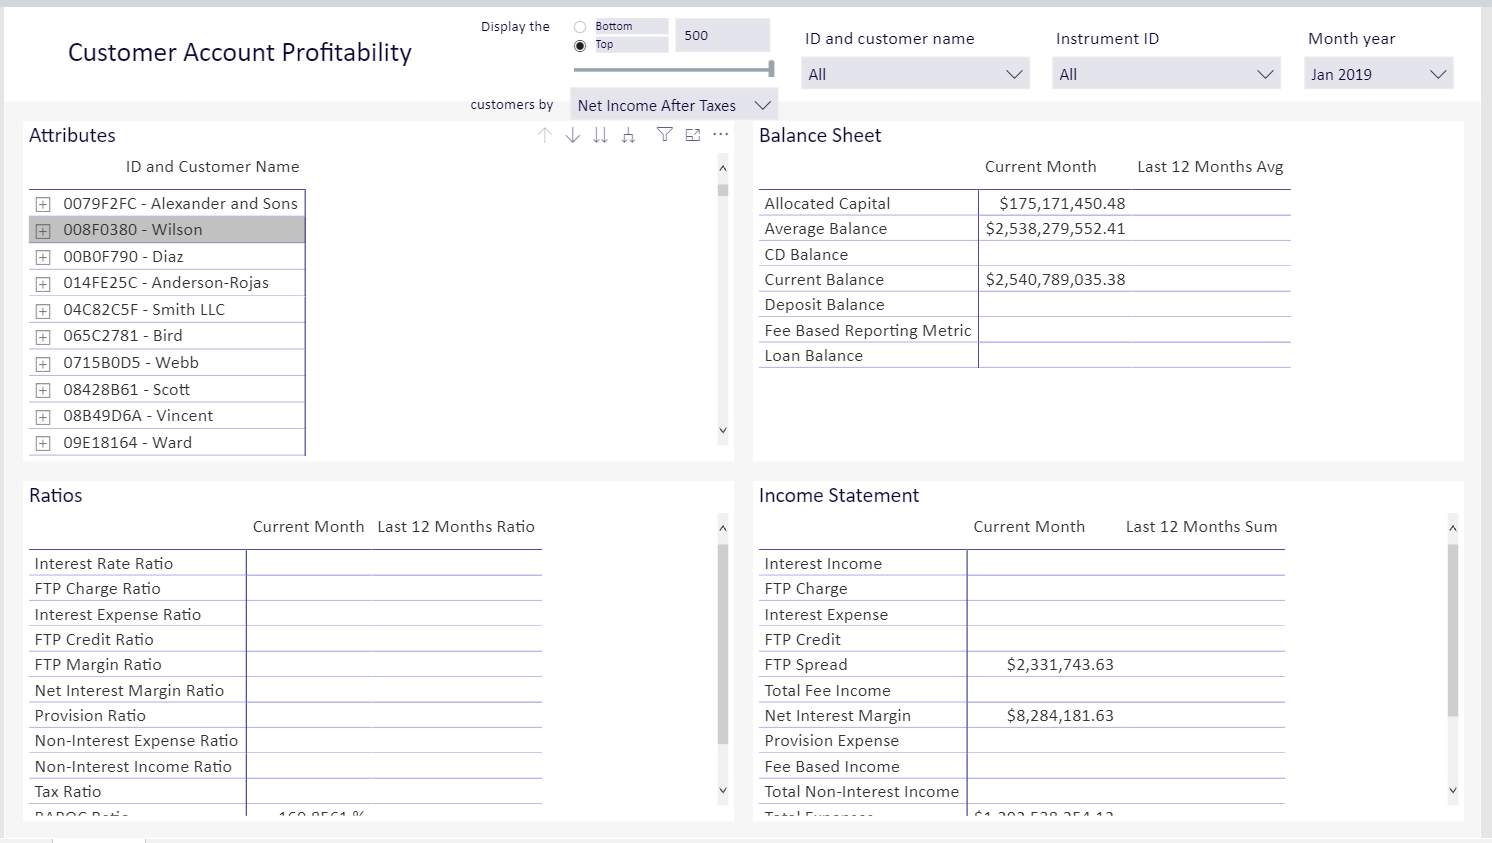
Click image to view full size
Report options include:
| Control | Description and Options |
|---|---|
| Display the |
The options buttons let you view either top or bottom customers according to profitability. You can define the number of customers to include in the view. The default setting is 500. |
| Customers by | You can view the customer set you defined by Deposit Balance, Instrument Count, Loan Balance, Net Income After Taxes, and RAROC, |
| ID and customer name | Customers are shown with a name and customer ID. You can view bubbles for all of the customer set you define or use this control to select one or more customers to view. |
| Instrument ID | By default, profitability is calculated using all of the instruments they have. You can select one or more instrument IDs to view profitability by just those instruments. |
| Month year | The default setting is for all months and years the customer has been with your institution. You can, however, select specific months and years for your evaluation. |
Attributes pane
This pane contains a list of customers for the set you define; the default is the top 500 customers sorted by profitability. You can expand any customer to view a list of the IDs for instruments associated with them
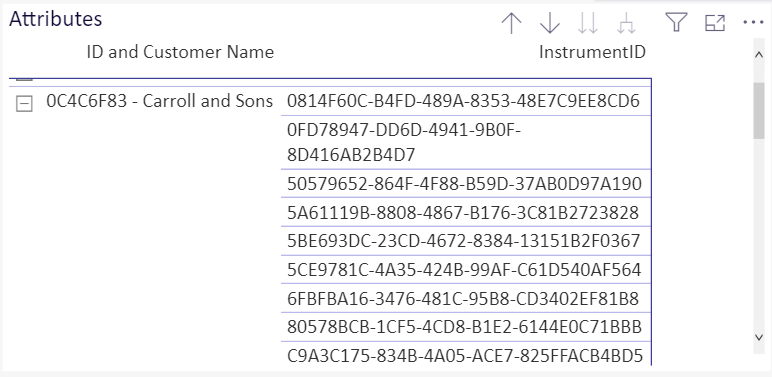
Click image to view full size
Additional tools affecting this pane include those for drilling through data, exporting data, sorting, and showing as a table.
Additional tools affecting this pane include those for drilling through data, exporting data, sorting, and showing as a table.
IMPORTANT: When you select a customer in the Attributes pane, the remaining panes in the report redisplay to show actuals for that customer.
Balance Sheet pane
This pane shows balances in various categories for the selected customer.
Click image to view full size
Additional tools support exporting data and other options.
Ratios pane
This pane shows available ratios for the selected customer.
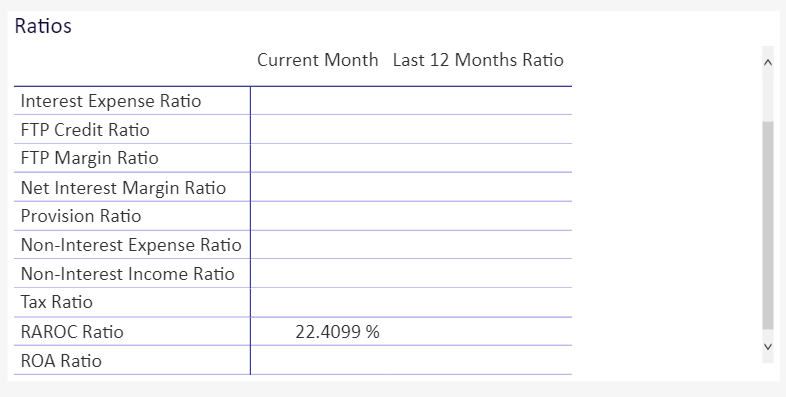
Click image to view full size
Additional tools support exporting data and showing as a table.
Income Statement pane
This page shows available income for the selected customer.
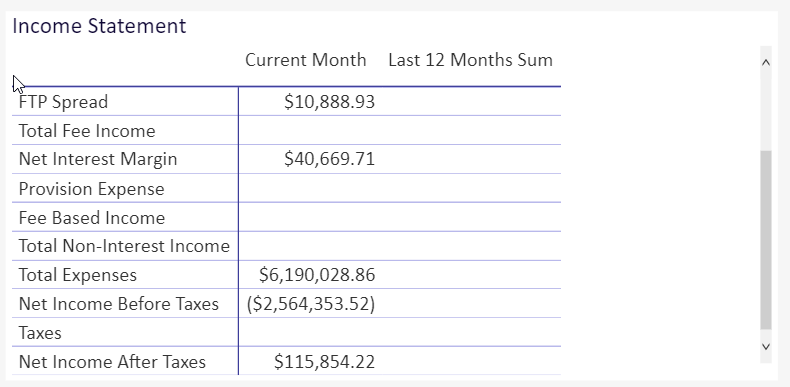
Click image to view full size
Additional tools support exporting data and showing as a table.
Details tab
This page shows expenses, non-interest income and fee income for a selected customer.
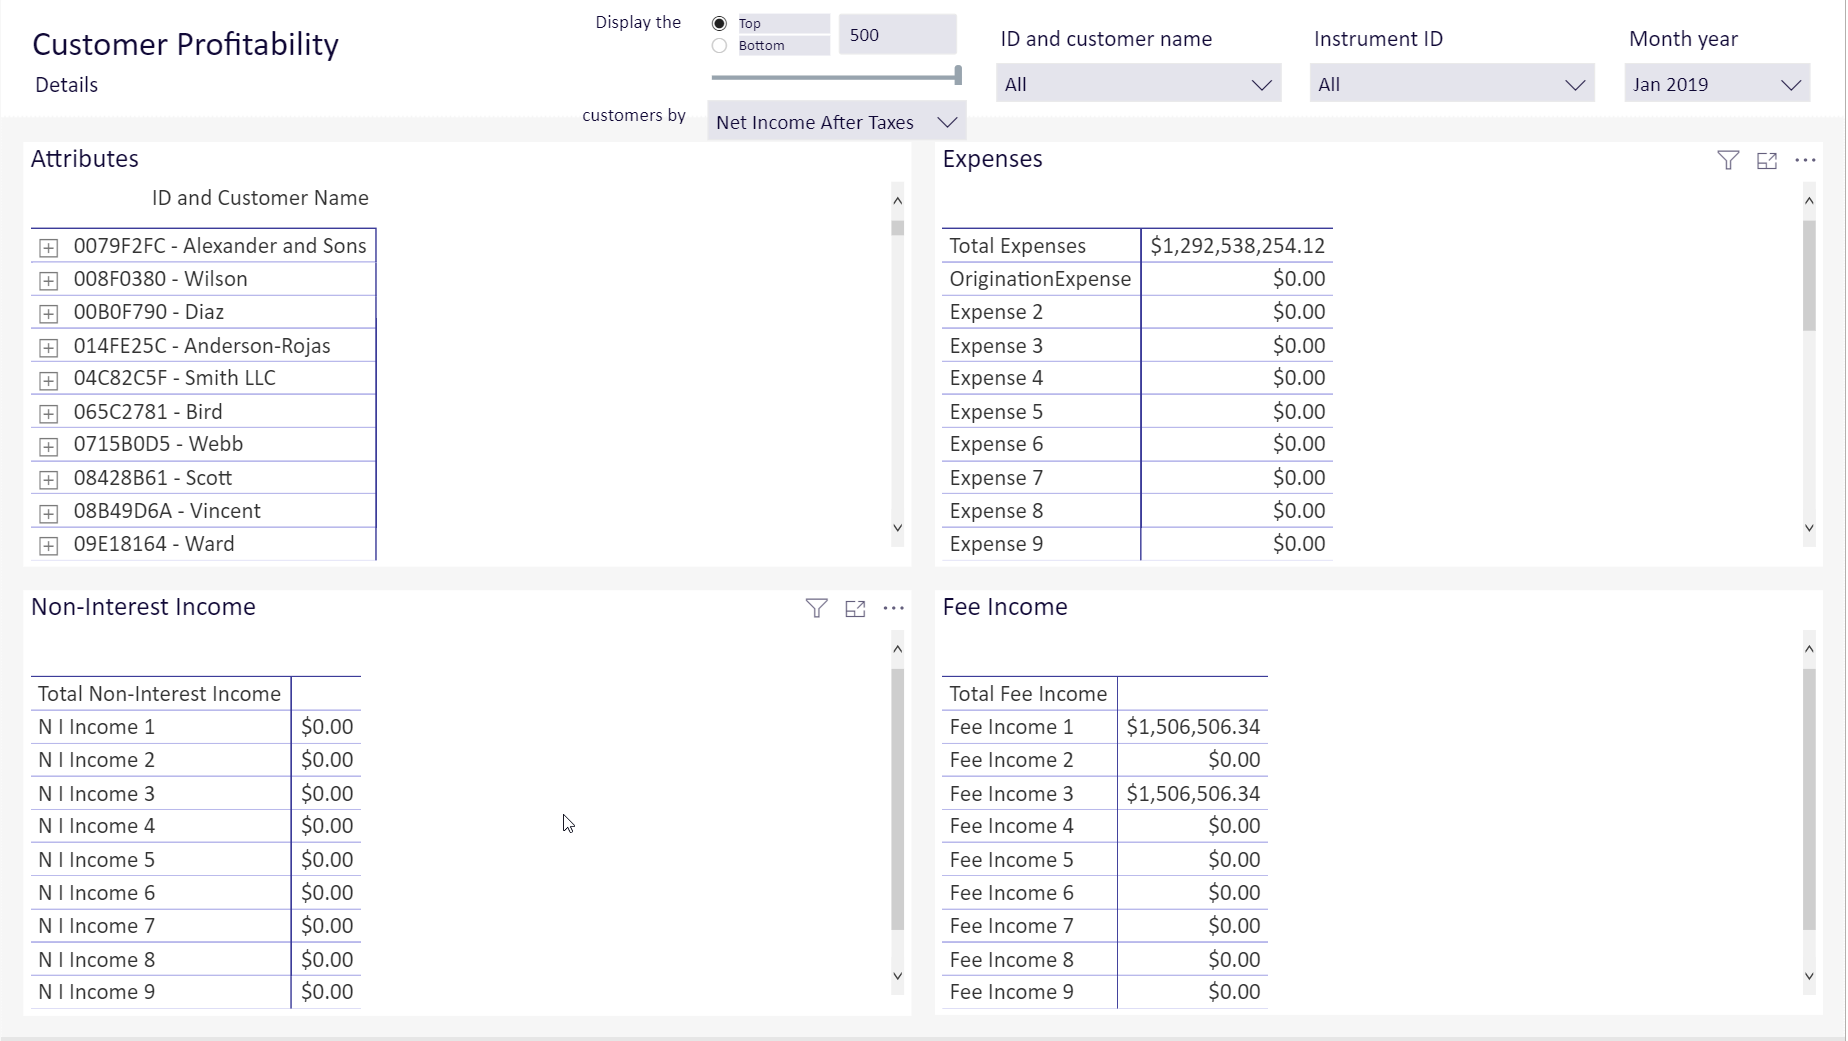
Click image to view full size
Report options include:
| Control | Description and Options |
|---|---|
| Display the |
The options buttons let you view either top or bottom customers according to profitability. You can define the number of customers to include in the view. The default setting is 500. |
| Customers by | You can view the customer set you defined by Deposit Balance, Instrument Count, Loan Balance, Net Income After Taxes, and RAROC, |
| ID and customer name | Customers are shown with a name and customer ID. You can view bubbles for all of the customer set you define or use this control to select one or more customers to view. |
| Instrument ID | By default, profitability is calculated using all of the instruments they have. You can select one or more instrument IDs to view profitability by just those instruments. |
| Month year | The default setting is for all months and years the customer has been with your institution. You can, however, select specific months and years for your evaluation. |
Attribute pane
This pane contains a list of customers for the set you define; the default is the top 500 customers sorted by profitability. You can expand any customer to view a list of the IDs for instruments associated with them.
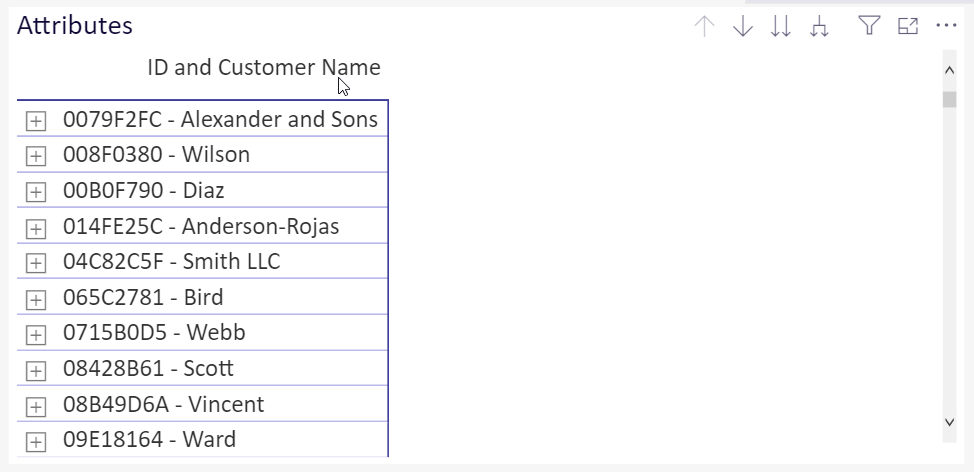
Click image to view full size
IMPORTANT: When you select a customer in the Attributes pane, the remaining panes in the report redisplay to show actuals for that customer.
Expenses
This pane shows expenses to the institution made in the support of the selected customer. These expenses include origination fees as well as other expenses tracked by your financial institution.
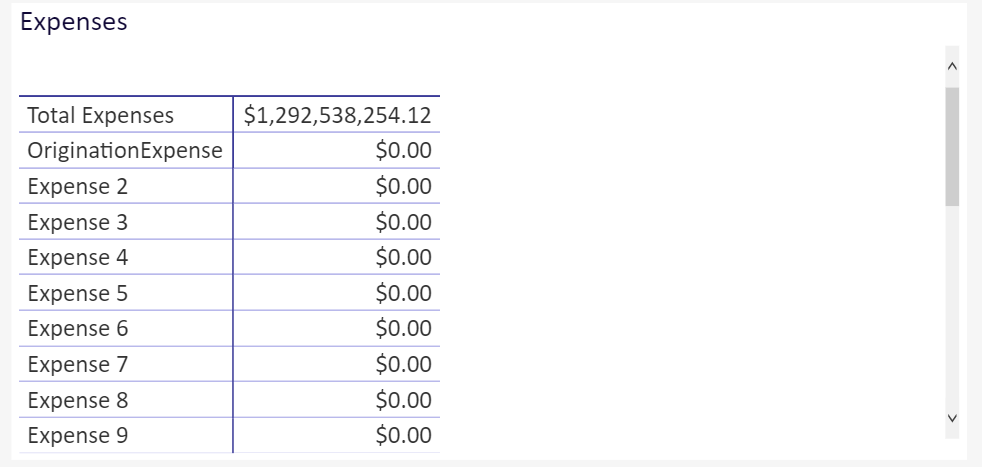
Click image to view full size
Additional tools support exporting data and showing as a table.
Non-Interest Income
This pane shows non-interest income to the financial institution from the selected customer.
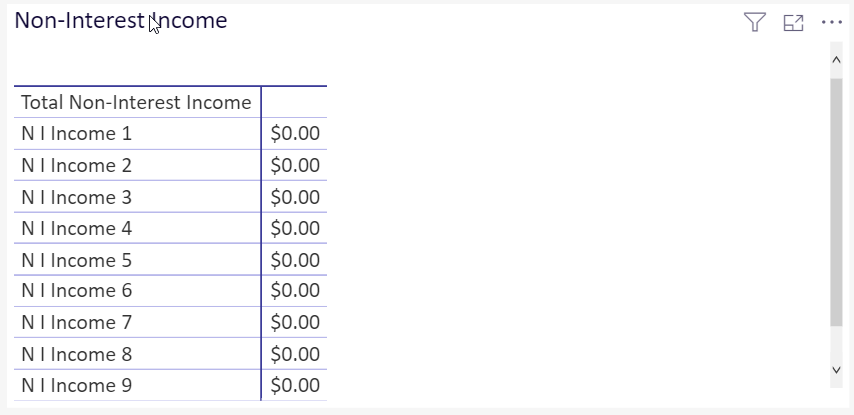
Click image to view full size
Additional tools support exporting data and showing as a table.
Fee Income
This pane shows fees paid by the selected customer.
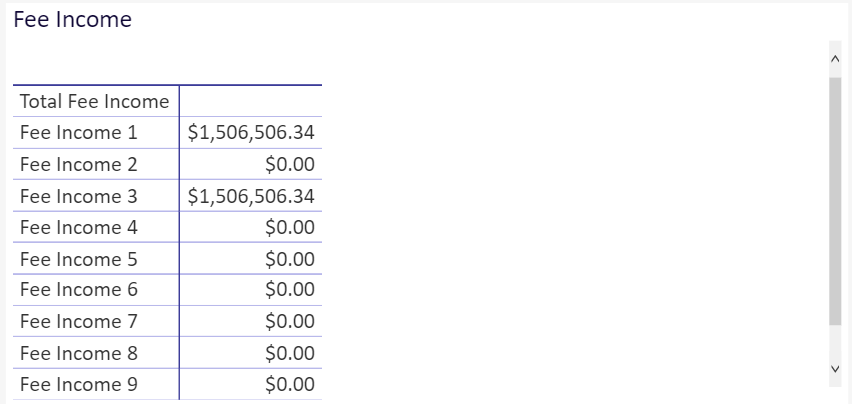
Click image to view full size
Additional tools support exporting data and showing as a table.
