Profitability Trends
Overview
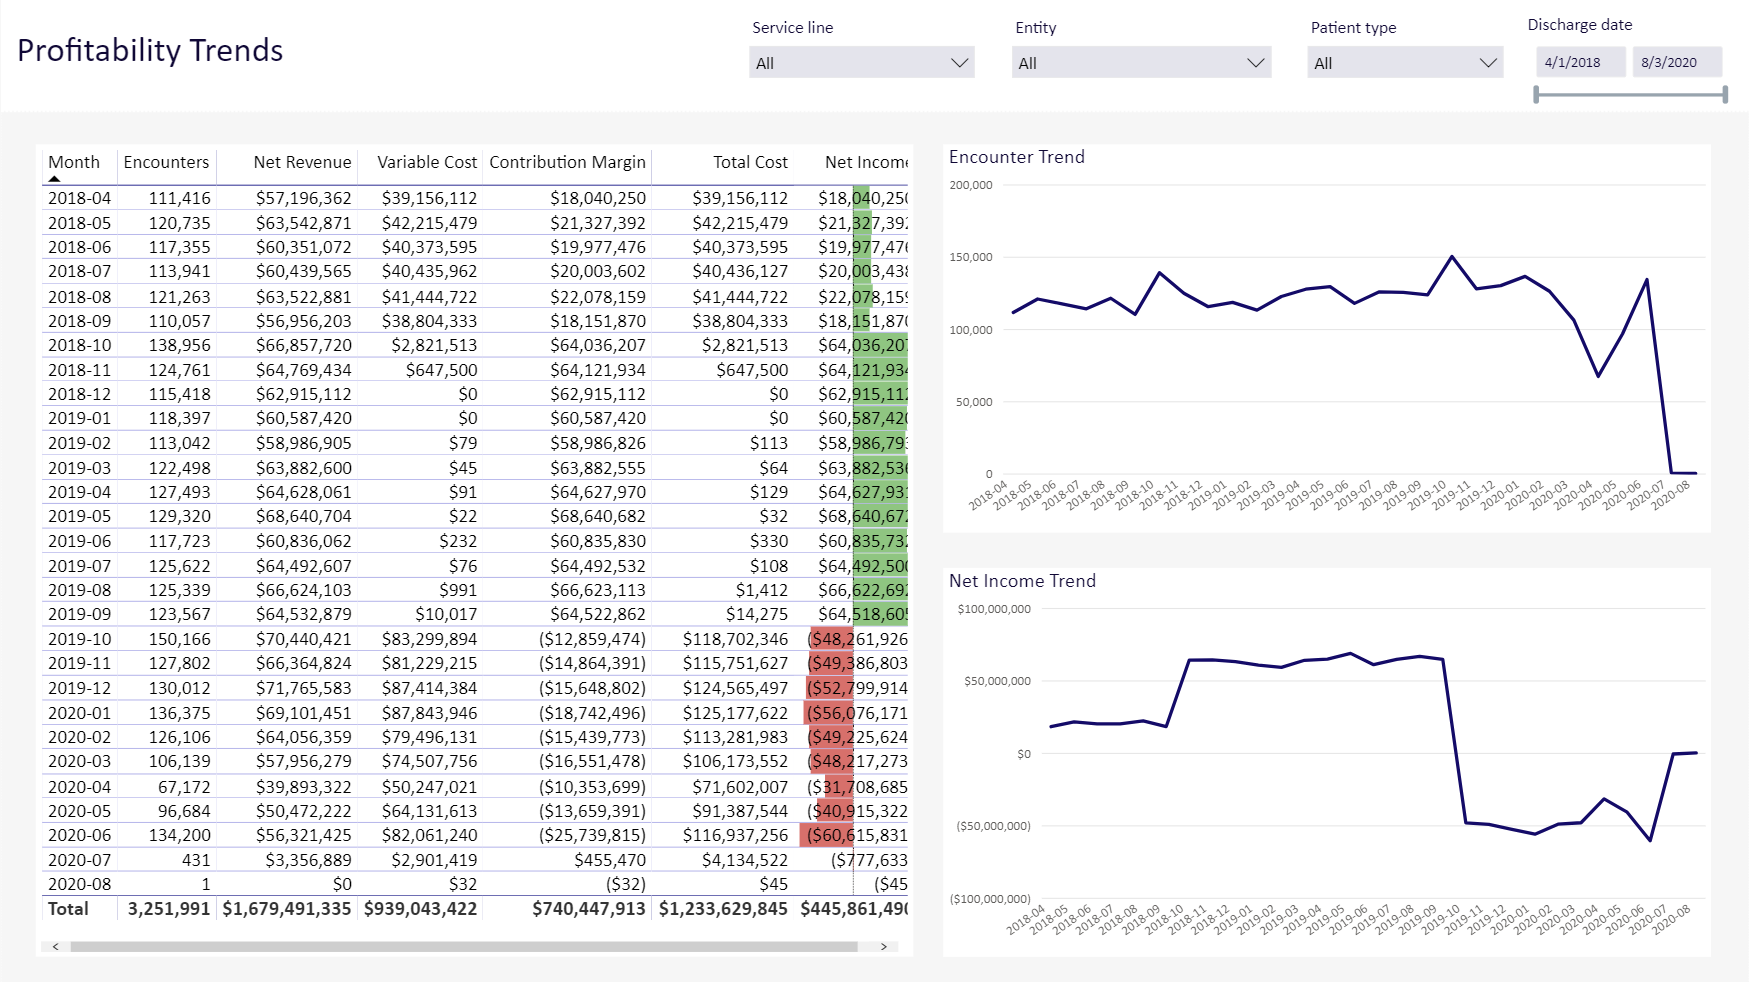
The Profitability Trends report provides encounter and financial data for each month in your data set for all service line(s) you selected. Use the filters to select one or more service lines to view.
Click image to view full size
Slicers
This report provides filtering options that let you create a set of data, giving you the option of viewing the precise data you want to view.
Service line
This drop-down lists all of the service lines defined for your institution. You can view all service lines or one or more individual service lines. To select multiple service lines, press and hold the CTRL key while you select.
Entity
The entity drop-down lists all of the clinics, hospitals, and other entities that comprise your institution. You can choose to view all of those entities or select a single entity to view.
Patient type
The patient drops-down lists the ways a patient was seen, such as inpatient or outpatient emergency. The list will show the patient types used in your organization.
Discharge date
This control lets you select a range dates of discharge. You can use the slider or, for more precision, click on each date box to choose a date from a calendar.
Discharge date range
This control lets you select a range of dates of discharge. You can use the slider or, for more precision, click on each date box to choose a date from a calendar.
TIP: Use the dashboard tools to view, export, and sort the data; view data as table; and more.
Profitability Trends
This report shows, by month in your date range, the encounters and financials for the service line(s) in your data set. If you click on a month, the Encounter and Net Income Trend charts redisplay with trends for month you selected.
Navigation
-
Use the tabs at the bottom of the page to view other related reports in the category
-
Use the Navigation menu in the upper-left corner to return to Recent places that you've visited or to the Intelligence Center.