Scorecards Sections
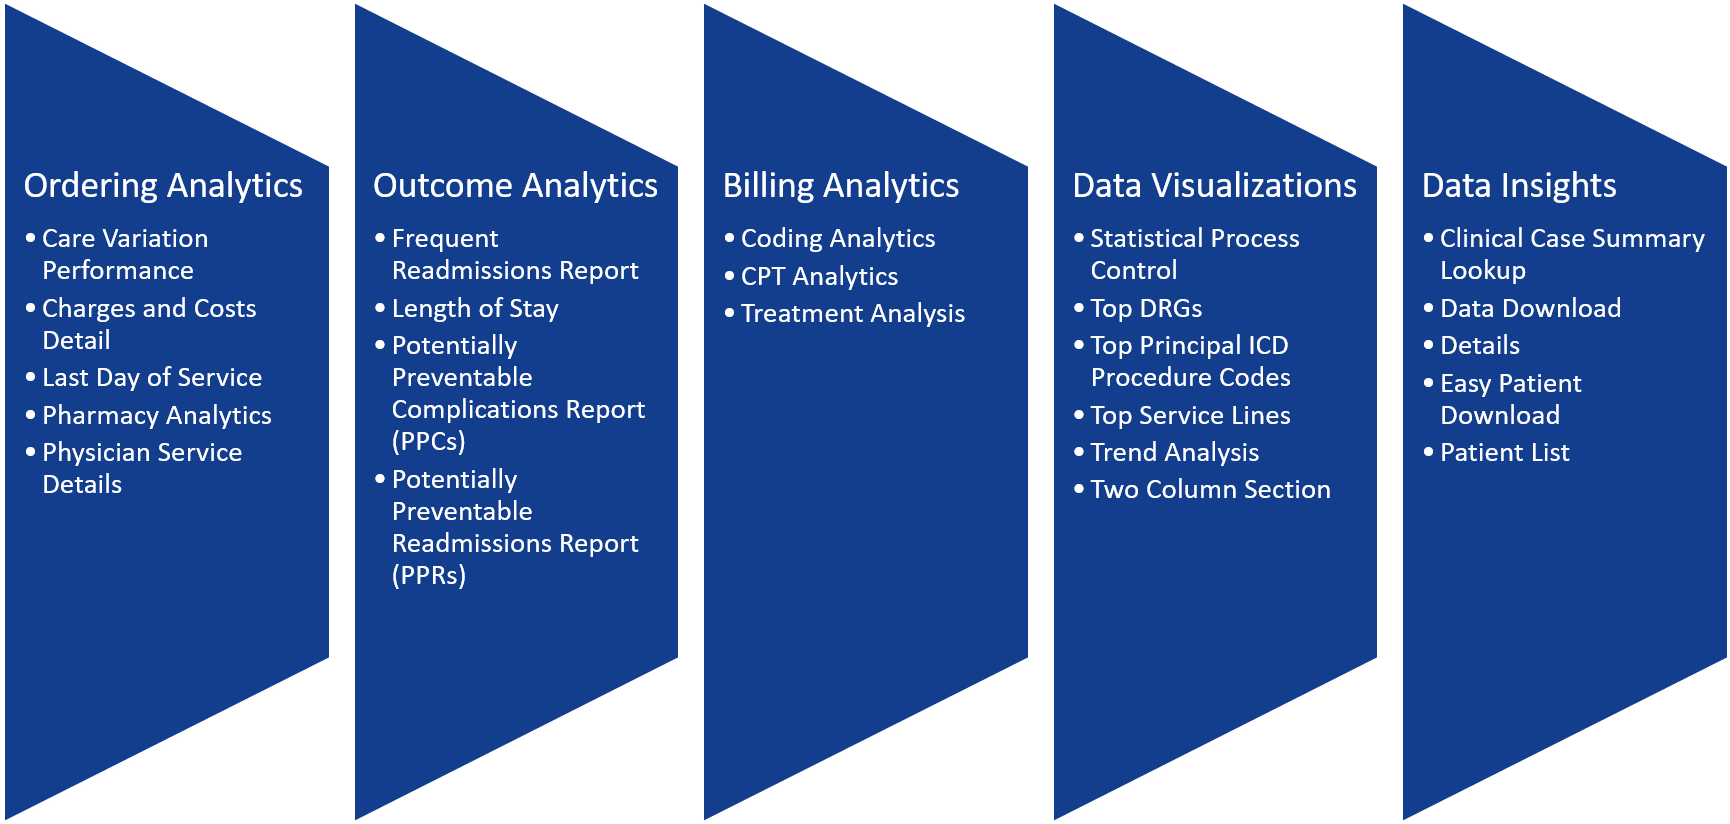
Section Categories
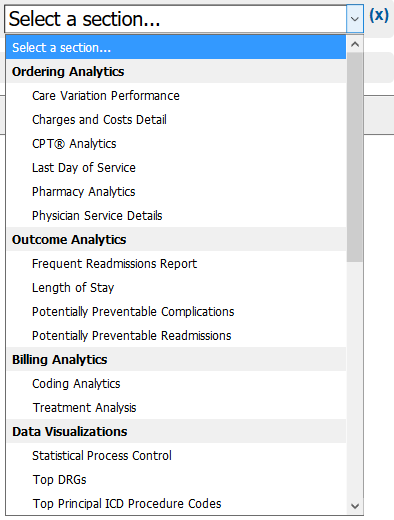
When adding a section to your scorecard, click +Add Section to select a section from the drop-down menu.

For more information about adding sections, see Customizing Scorecards.
The sections in the drop-down menu are organized into categories, as shown below.
Click a section name in the list below to see an explanation of that section.
Ordering Analytics Sections
- Care Variation Performance: helps identify sources of variation (practice, condition, volume or price) between user-selected profiles
- Charges and Costs Detail: data table and pie chart of cost/charge distribution between revenue code categories
- Last Day of Service: allows you to analyze services provided on last and next-to-last days of stay
- Pharmacy Analytics: six levels of analysis regarding pharmaceutical charges
- Physician Service Details: CDM-level analysis; identifies differences between physician practices
Outcome Analytics Sections
- Frequent Readmissions Report: pulls all patients in the profile with a readmission to identify "frequent flyers" and determine related readmissions
- Length of Stay: data table and pie charge to analyze LOS based on types of room charges
- Potentially Preventable Complications Report (PPCs): Based on PPC license; analysis of cases with PPC incidents
- Potentially Preventable Readmissions Report (PPRs): Based on PPR license; analysis of cases with PPRs
Billing Analytics Sections
- Coding Analytics: intended to identify potential areas of CDI (clinical documentation improvement) based on MS-DRG clusters
- Treatment Analysis: CDM-level analysis; intended to identify treatment differences between similar patients
Data Visualization Sections
- Statistical Process Control: Severity- and volume-adjusted control charts & adverse event charts for select cohorts
- Top DRGs: data table and pie chart of 20 most common DRGs
- Top Principal ICD Procedure Codes: data table and pie chart of 20 most common principal procedure codes
- Top Service Lines: data table and pie chart of 20 most common service lines
- Two Column Section: measure-specific speedometers or line charts to visualize performance at-a-glance against a benchmark or over time
Data Insight Sections
- Clinical Case Summary Lookup: Enter an account number or Axiom Encounter ID to be taken directly to the CCS containing all details of a patient encounter
- Clinical Case Summary Lookup (or clicking a hyperlinked Axiom Encounter ID) will take you to view the Clinical Case Summary for that patient encounter.
- Data Download: when exporting large CSV files, you can select to save to this section instead of waiting for the download
- Details: customizable data table; add any measure or stratification for a powerful, dynamic analysis
- Easy Patient Download: provides a simple platform to export patient-level information including all diagnosis codes, procedure codes, and charge items
- Patient List: extract a list of all patients with a specific flag/incident (HAC, PSI, readmission, mortality, core measure)
Adding the Section
When you click the drop-down menu to add a section, it will add that section to the bottom of the tab you are looking at. Some sections will have customization options; click the green check mark in the top right corner to exit Customizer Mode and see your data.

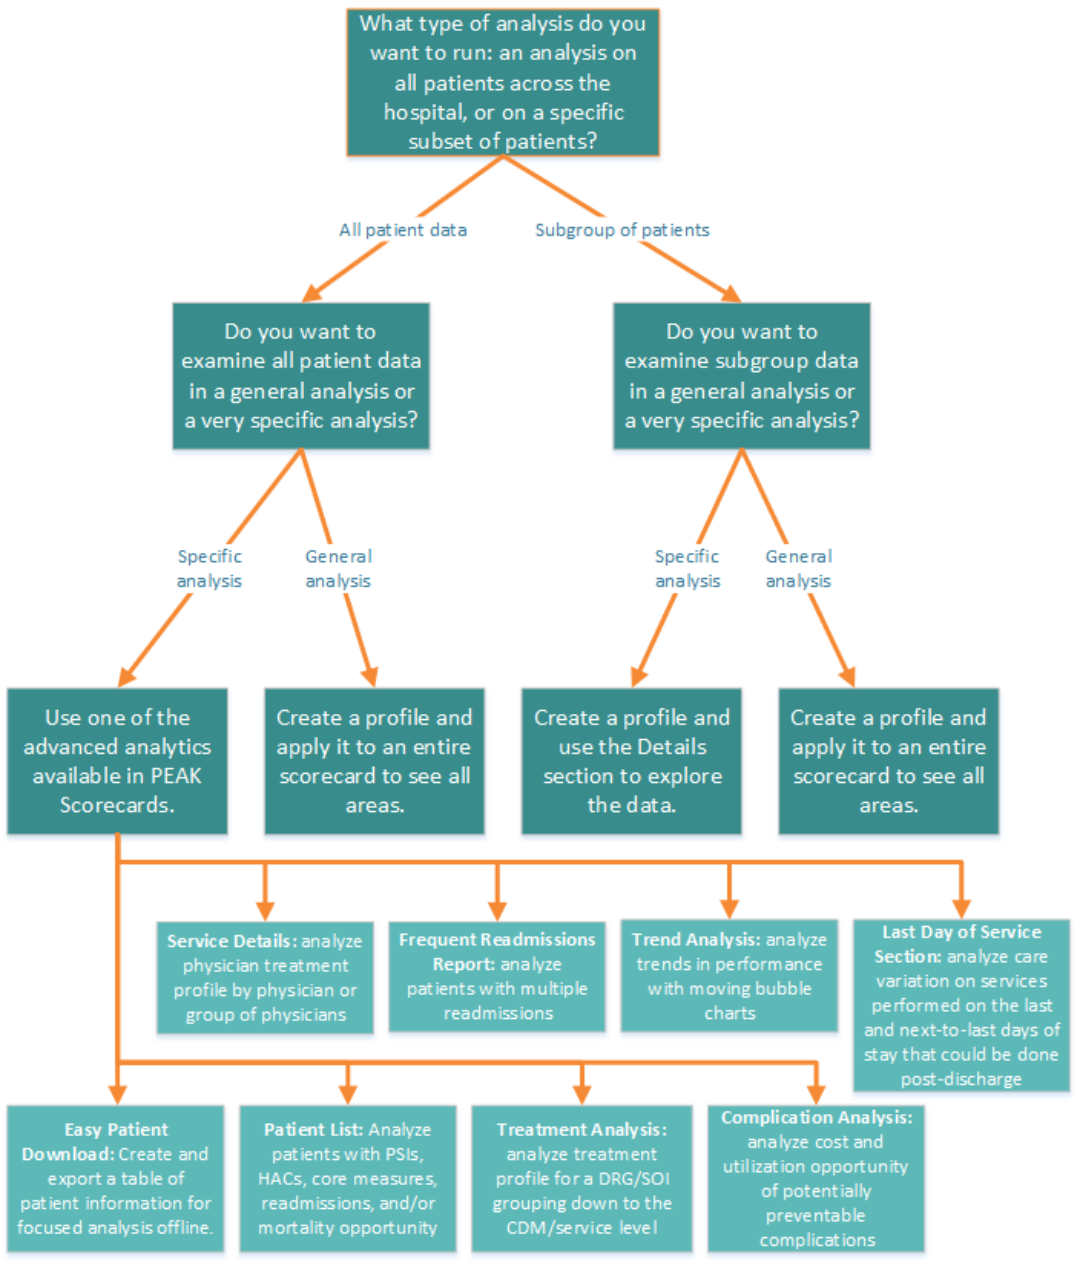
Still trying to decide?
Use the following decision tree to help you decide which section might be best for your analysis.