Volumes and Financials dashboard
Why use this feature
Volumes and Financials provide details for all encounters, including encounters and costs, trends, net incomes, and inpatient mortality.
Click image to view full size
The reports are:
-
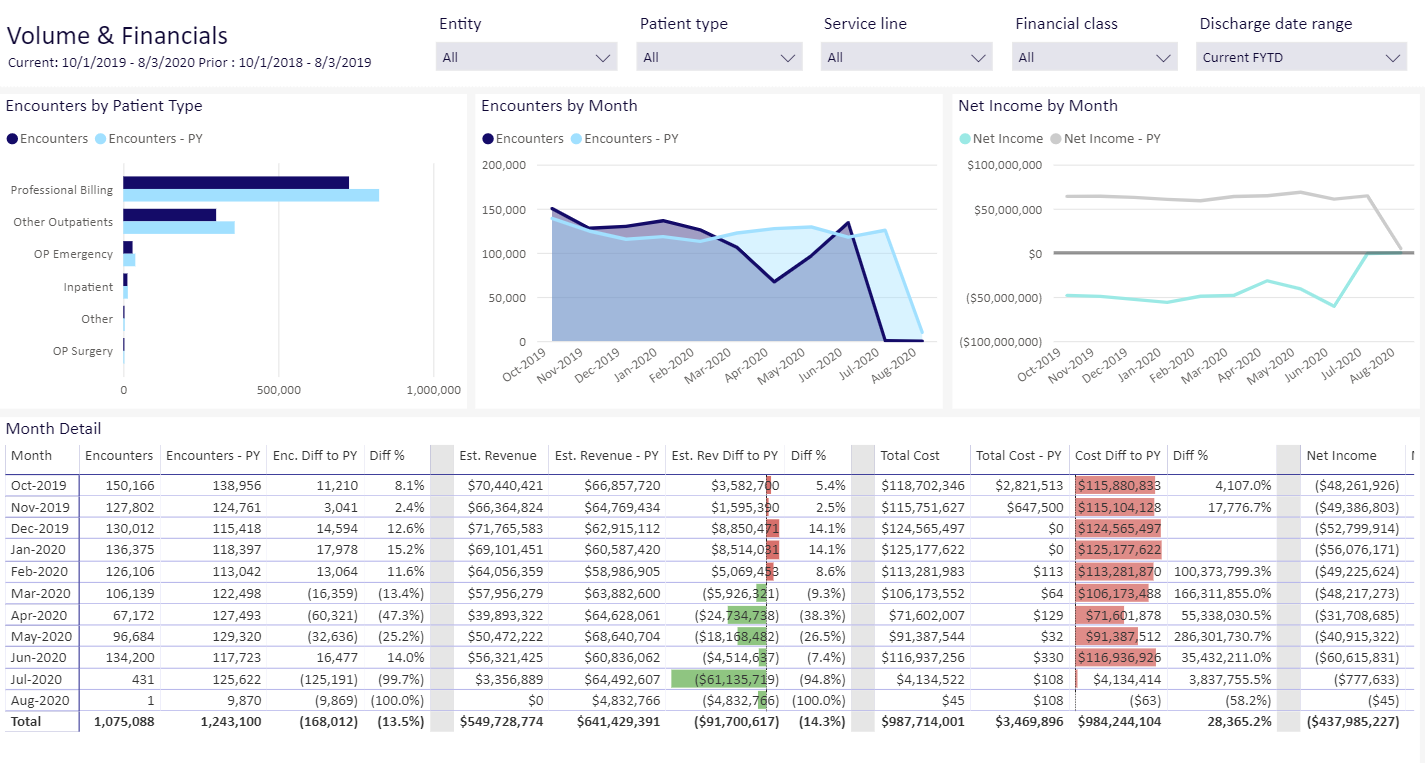
Volumes & Financials: This report shows encounters and the associated costs on a monthly basis, and net incomes. It compares the current year encounters with the previous year for the same month.
-
Trends: This report has three trend views. First is a list of all the months in the date range you selected, with the number of encounter, estimated revenue, total cost, and net income. Next is a graph of the number of encounters over your date range. Net Income Trend shows net incomes using a base line of $0, giving you a quick view of positive and negative net income over your date range.
-
Provider Detail: First, this report shows percentages of encounters by the financial class. Next is a table of providers with their encounters, costs, and net income. Totals for all provides is also provided.
TIP: For easier viewing, click once in a row you want to review to dim the other rows in the table.
-
Provider Net Income: You can view volume and net income in a bubble chart. Use splicers to customize the view, such as by service line or financial class. You can use multiple selections in splicer drop-down menus.
-
Inpatient Mortality: This report lets you view mortality for inpatients in several ways. First, the mortality rate is shown in a graph by the month over your chose date range. Next, table lists counts for encounters and death within those encounters and the mortality rate: the data may be viewed by attending provider, DRG, provider specialty or service line. Finally, a chart shows deaths by standard age ranges.
-
Net Income: Income, both positive and negative, is shown on a cumulative chart over your selected date range.
How this feature works
What: You view a dashboard and use slicers and built-in dashboard tools to select the exact entities, length of stay, date ranges, and other data elements to select the precise data you want to work with.
Where: From the Enterprise Decision Support home page, in the Reporting section, click Intelligence Center. From the Intelligence Center, click Enterprise Decision Support, then click Standard Dashboards, then Volumes and Financials.
Who: Users assigned the EDS User role profile.
How: Use slicers and other dashboard tools to specify the entities, service lines, and other data types to view the needed subset of the data on each dashboard.
TIP: To use this feature, we recommend that you read all of the associated online help topics listed in the "Where to find more information" section below.
Where to find more information
The following topics in the online help have been added or updated with information and instructions for using this feature:
