Inpatient Mortality
Overview
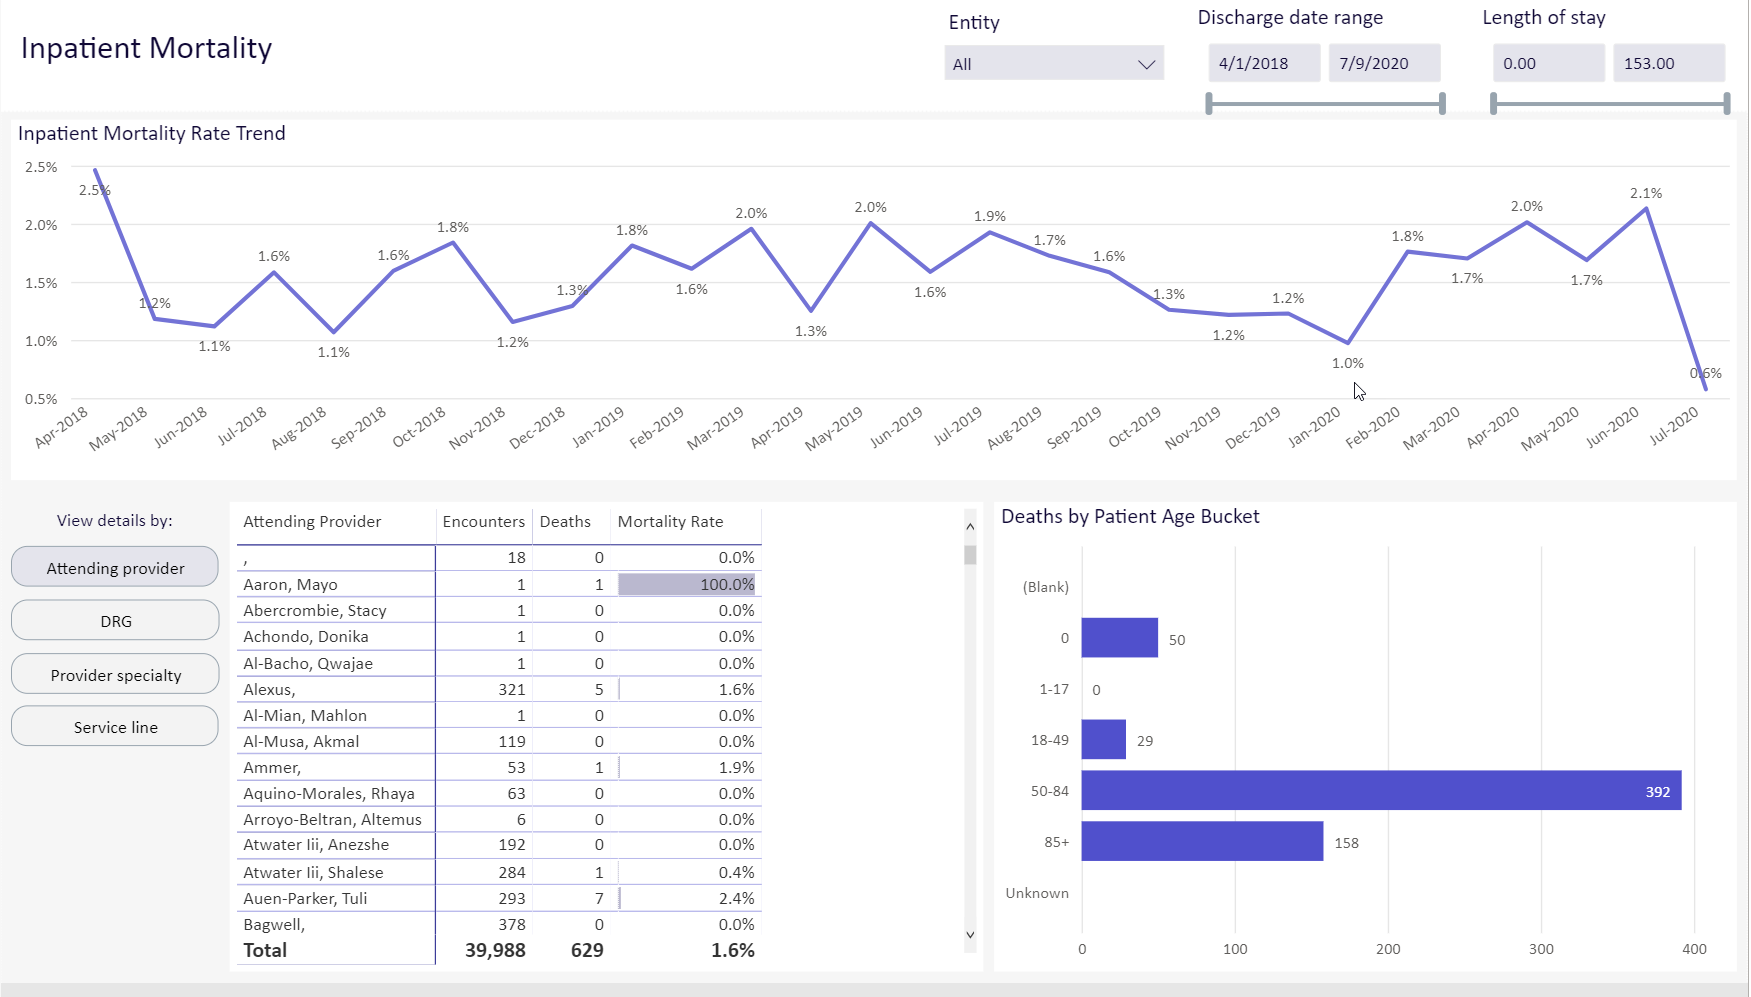
Use this report to examine the institution's mortality rates by date range and/or length of stay. You can view mortality details by several different categories and see patient death by age range.
Click image to view full size
Slicers
Entity
The entity drop-down lists all of the clinics, hospitals, and other entities that comprise your institution. You can choose to view all of those entities or select a single entity to view.
Discharge date range
This control lets you select a range of dates of discharge. You can use the slider or, for more precision, click on each date box to choose a date from a calendar.
Length of stay
This control lets you select a range of days for length of stay. You can use the slider or, for more precision, click on each box to type in a number of days.
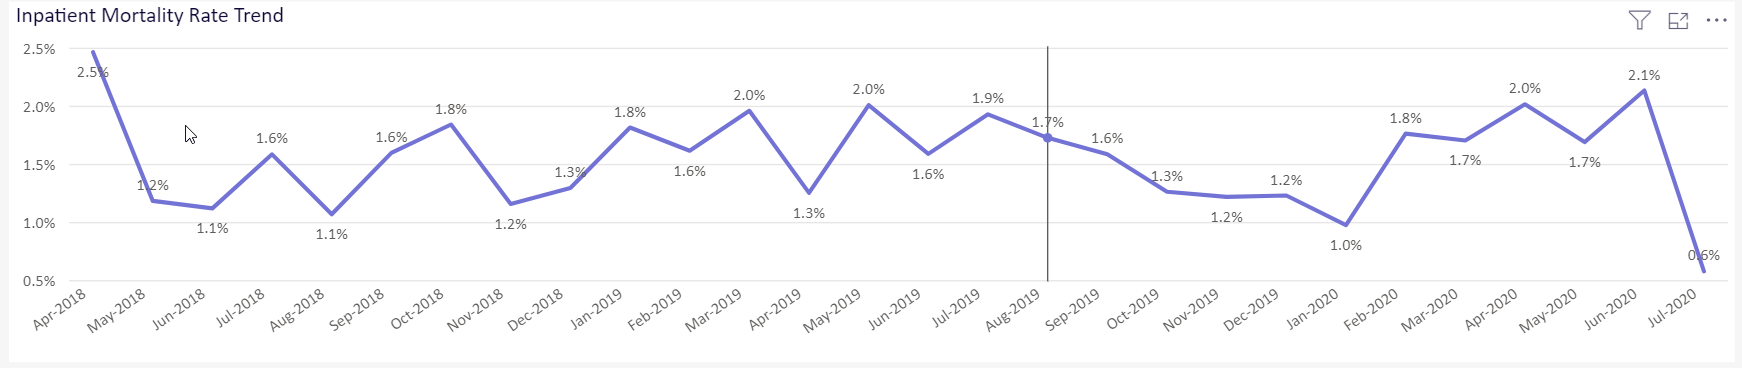
Inpatient Mortality Rate Trend
This chart shows mortality trends over your date range. You can view the trend for all providers, or choose a single attending physicians, DRG, provider specialty, or service line to view.
You can move your cursor over any node on the chart to view mortality details.
Click image to view full size
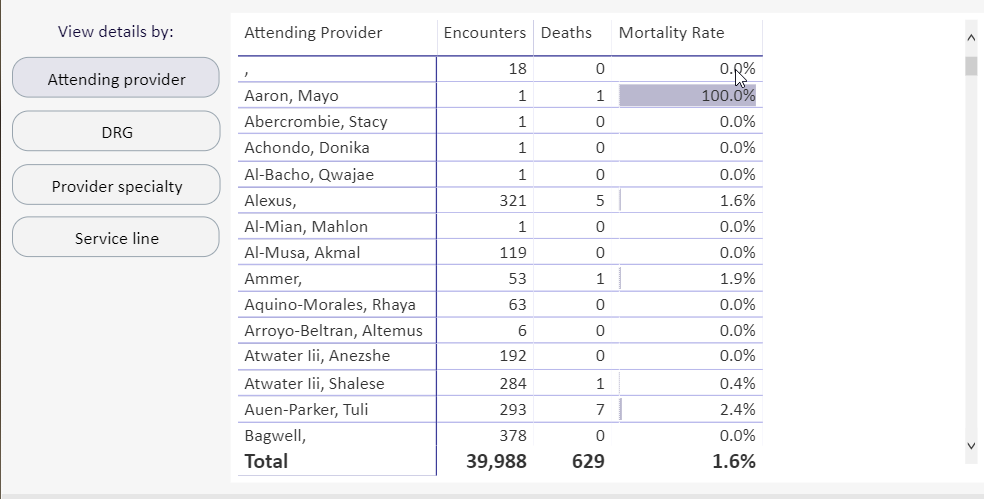
View details by
This chart allows you to choose to view details by attending provider, DRG, provider specialty, or service line. For each category, you will see the number of encounters and deaths and the effective mortality rate. The choice of category determines the data for the rate trend chart.
Click image to view full size
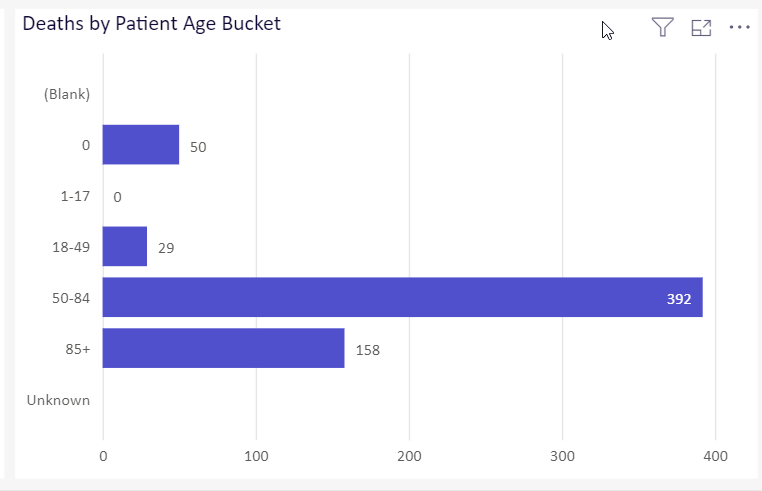
Death by Patient Age Bucket
This bar chart shows the number of inpatient deaths by standard age categories.
Click image to view full size
Navigation
-
Use the tabs at the bottom of the page to view other related reports in the category
-
Use the Navigation menu in the upper-left corner to return to Recent places that you've visited or to the Intelligence Center.