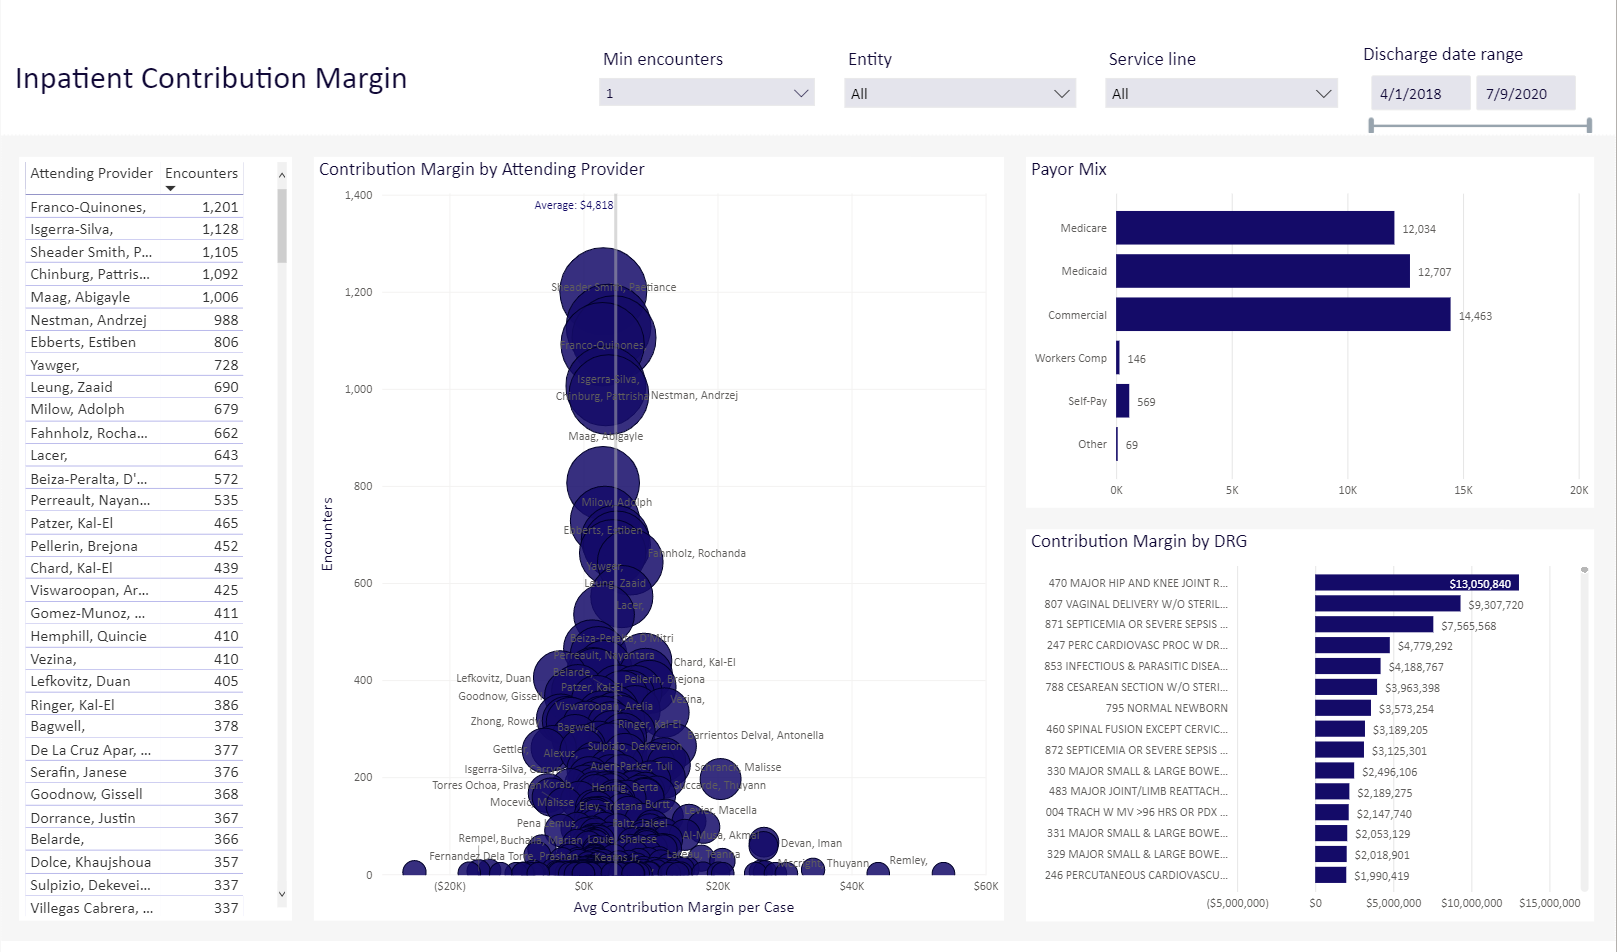
Inpatient Contribution Margin
Overview
The contribution margin let you view contributions of attending providers in the entity or entities and service line(s) you specify.
Click image to view full size
Slicers
This report provides filtering options that let you create a set of data, giving you the option of viewing the precise data you want to view.
Min encounters
Use this drop-down to select the minimum number of encounters that attending providers who have had in the date range you specified. The default is 1 encounter.
Entity
The entity drop-down lists all of the clinics, hospitals, and other entities that comprise your institution. You can choose to view all of those entities or select a single entity to view.
Service Line
Use this drop-down to select the service lines you want to examine in this report. You can select all service lines, a single service line, or several service lines. To select multiple service lines, press and hold the CTRL key while you select the check boxes for each service line you want to view.
Discharge date range
This control lets you select a range of dates of discharge. You can use the slider or, for more precision, click on each date box to choose a date from a calendar.
TIP: Use the dashboard tools to view, export, and sort the data; view data as table; and more.
Attending Provider
A list of all attending providers and the number of their encounters. You can select a single attending provider from the list. All of the charts in the report will redisplay, showing only the data for that attending provider.
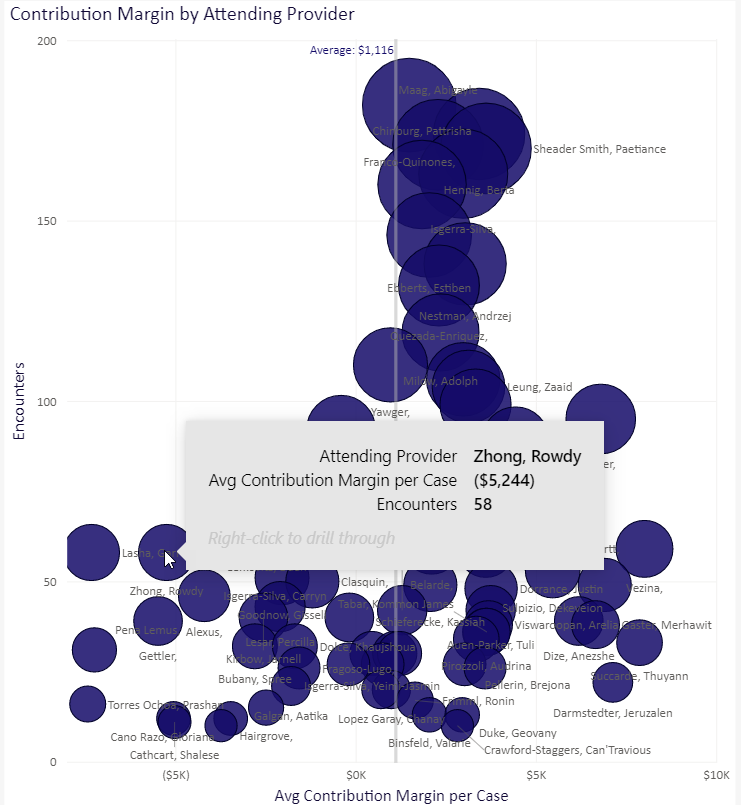
Contribution Margin by Attending Provider
Click image to view full size
This bubble chart shows the contribution margin for the attending physician(s) you specify. The y-axis is for the number of encounters; the x-axis is for the average contribution margin per case. The bubbles are sized related to the number of encounters. If you hover over a bubble, you see the provider's name, average contribution margin per case, and number of encounters.
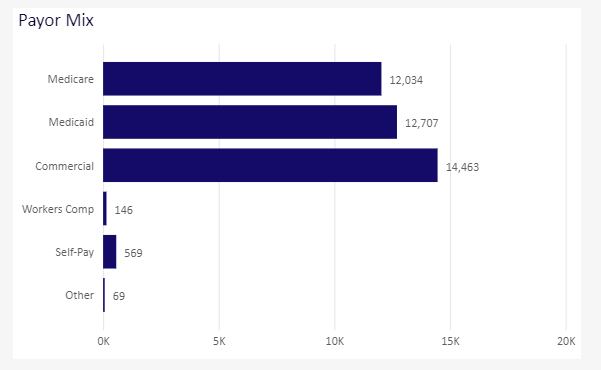
Payor Mix
Click image to view full size
This bar chart shows the dollar amount paid by these categories: Medicare, Medicaid, Commercial insurance, Workers comp, self pay, and any other type of payment.
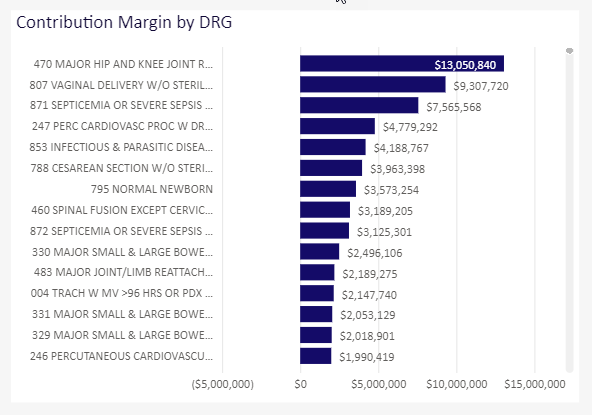
Contribution Margin by DRG
Click image to view full size
This bar chart shows the contribution margins by DRG for the attending physician(s) specified.
Navigation
-
Use the tabs at the bottom of the page to view other related reports in the category
-
Use the Navigation menu in the upper-left corner to return to Recent places that you've visited or to the Intelligence Center.