Confirmed COVID-19 Encounters
Overview
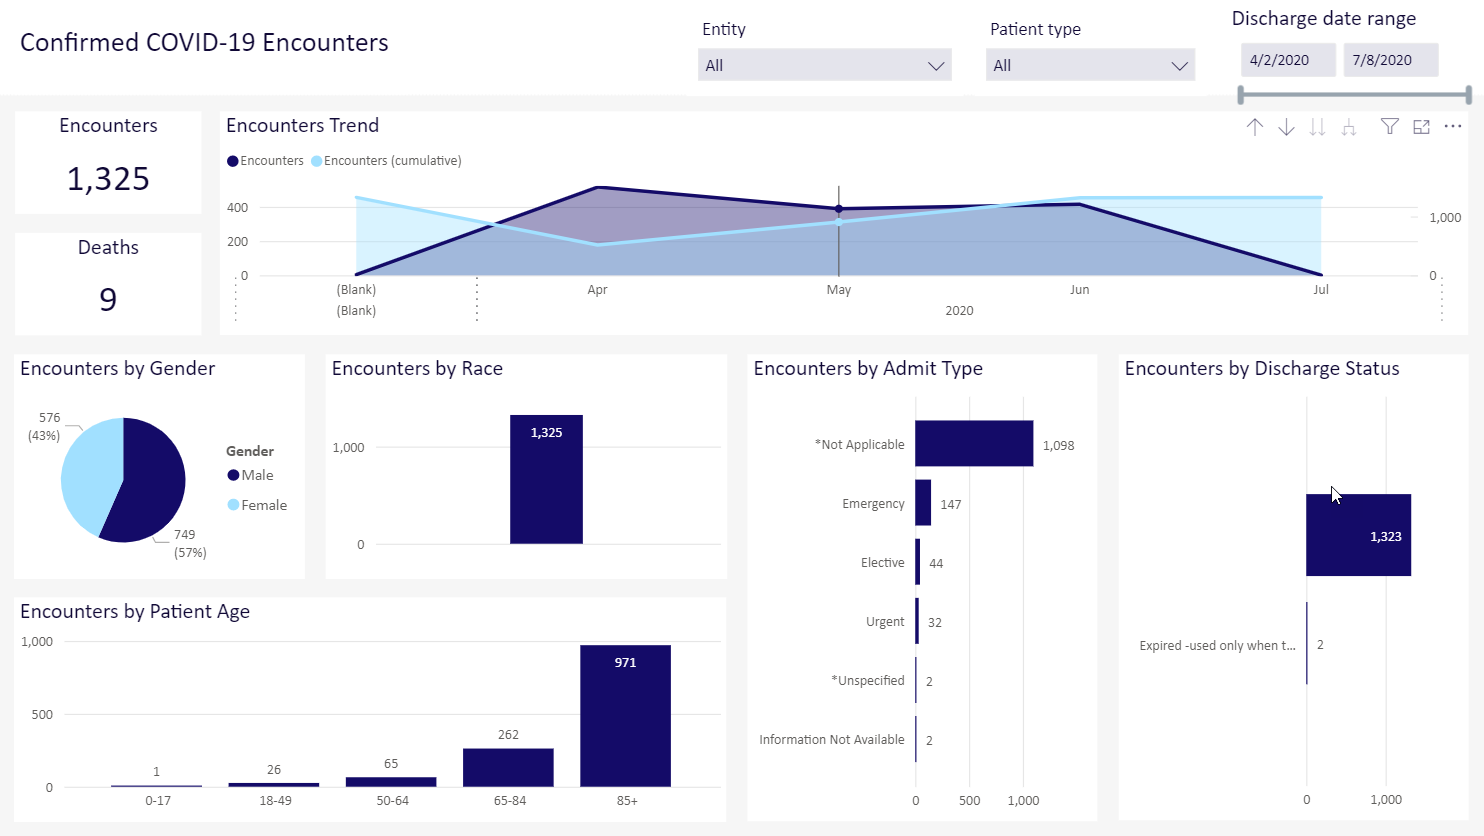
The Confirmed COVID-19 Encounters report provides historical data for all encounters as defined by your filters. You will the total number of encounters with the number deaths in that set. The encounters are shown by gender, face, admission type, discharge status, and patient age.
Click image to view full size
Slicers
This report provides filtering options that let you create a set of data, giving you the option of viewing the precise data you want to view.
Entity
The entity drop-down lists all of the clinics, hospitals, and other entities that comprise your institution. You can choose to view all of those entities or select a single entity to view.
Patient type
The patient drops-down lists the ways a patient was seen, such as inpatient or outpatient emergency. The list will show the patient types used in your organization.
Discharge date range
This control lets you select a range of dates of discharge. You can use the slider or, for more precision, click on each date box to choose a date from a calendar.
TIP: Use the dashboard tools to view, export, and sort the data; view data as table; and more.
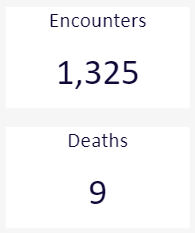
Encounters and deaths
This section displays the number confirmed COVID-19 encounters for the entities based on your slicer options. A confirmed encounter can occur in inpatient, observation, and emergency settings. The total number of encounters displays, as well as the number of deaths within that encounter set. The count of deaths is determined by a death entry in the encounter record. Patient records are not used to determine this count.
Click image to view full size
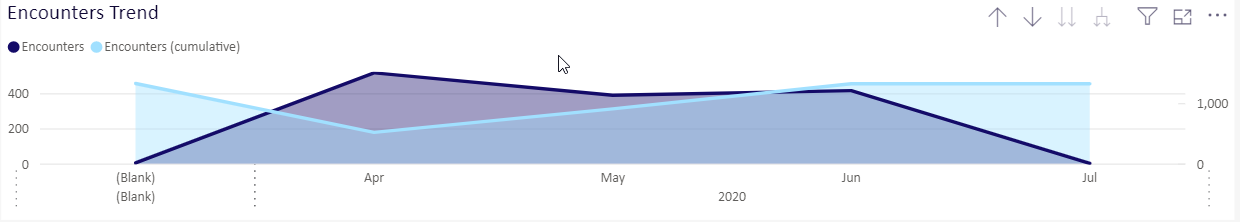
Encounters Trend
This dual-bar chart shows the numbers for encounters and cumulative encounters over the discharge date range you set in that slicer. This chart offers special tools for viewing the data. You can drill up or drill down at a point in the trend line.
Click image to view full size
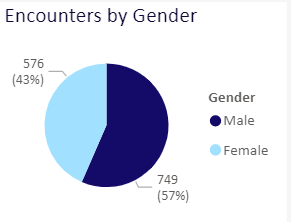
Encounters by Gender
This pie chart displays the encounter count by gender, where gender is defined by your organization.
Click image to view full size
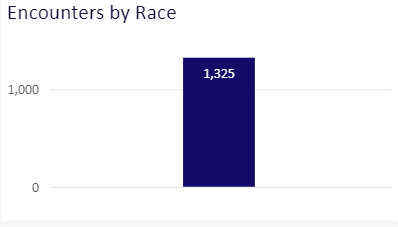
Encounters by Race
This bar chart displays the encounter count by race, where race is defined by your organization.
Click image to view full size
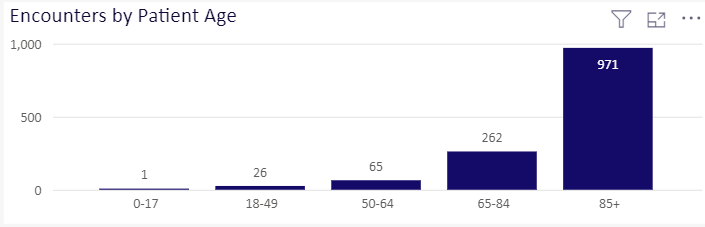
Encounters by Patient Age
This bar chart groups the encounters by patient age. The groups are:
-
0-17
-
18-49
-
50-4
-
65-84
-
85 and older
Click image to view full size
Encounters by Admit Type
This chart breaks down the encounter group by how they were admitted. Admit types may include emergency room, urgent care, and an elective visit to a physician.

Click image to view full size
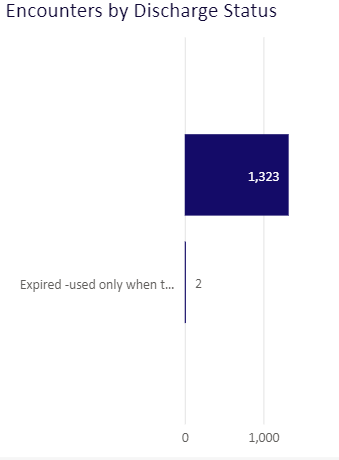
Encounters by Discharge Status
This chart shows discharge information for the encounter group. Patients may be discharged to home, hospital, or a short-term care facility. Patients who died are also listed on this chart as expired. Note that the data for deaths is taken from the encounter data set, not individual patient records.
Click image to view full size
Navigation
-
Use the tabs at the bottom of the page to view other related reports in the category
-
Use the Navigation menu in the upper-left corner to return to Recent places that you've visited or to the Intelligence Center.