Using the Physician Reporting dashboard
Use the Physician Reporting dashboard to monitor operational and financial performance of physicians, specialties, and practices, to identify opportunities for cost saving and growth.
NOTE: You must have the Comparative Analytics Physician role or Admin role to access the Physician Reporting dashboard. For details on system security settings, see Managing user access to Axiom Intelligence.
To access Physician Reporting, a separate license is required. For details, contact your sales representative or Client Relations Executive.
To open this dashboard, click the Physician Reporting link on the Axiom Comparative Analytics home page.
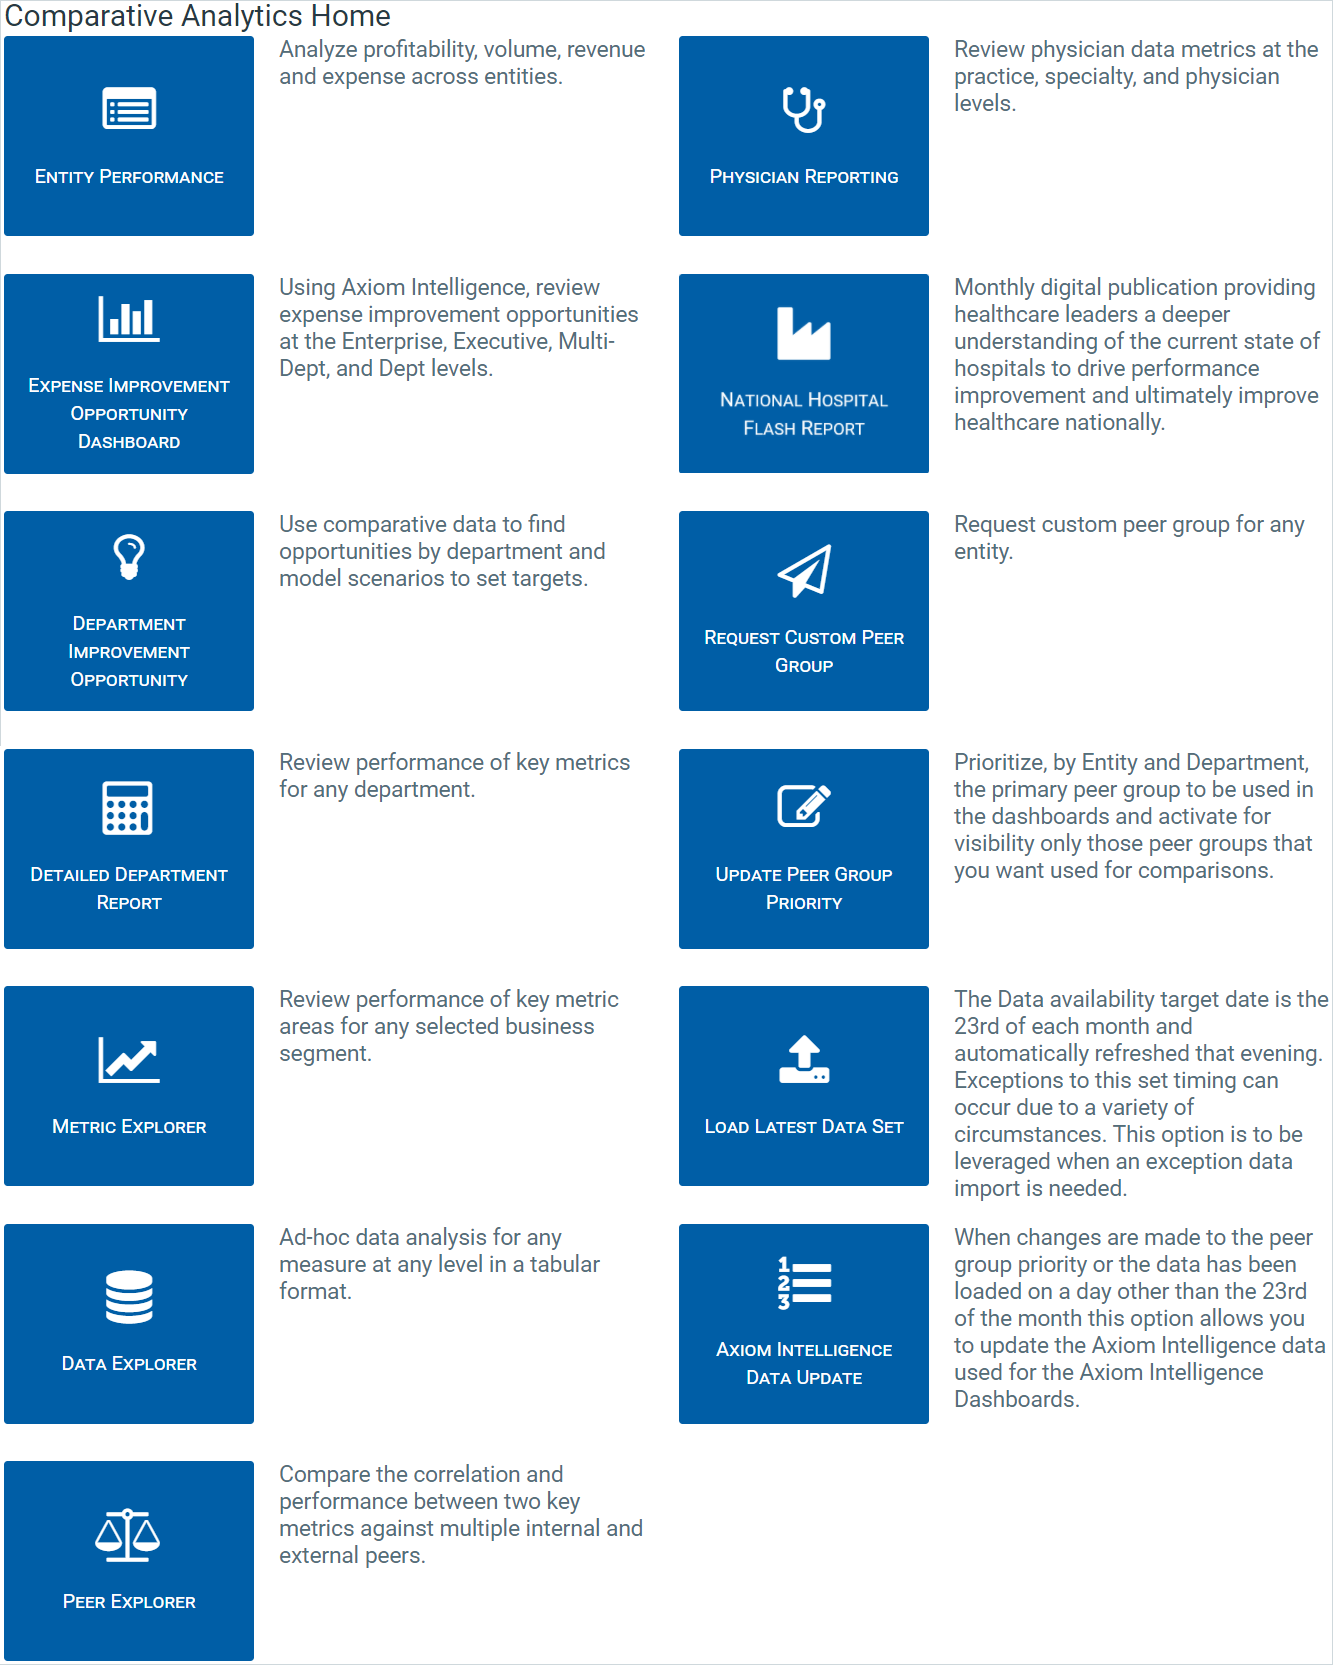
Axiom Comparative Analytics Home page (click to enlarge)
The dashboard includes links to performance and detailed data for the following reporting levels:
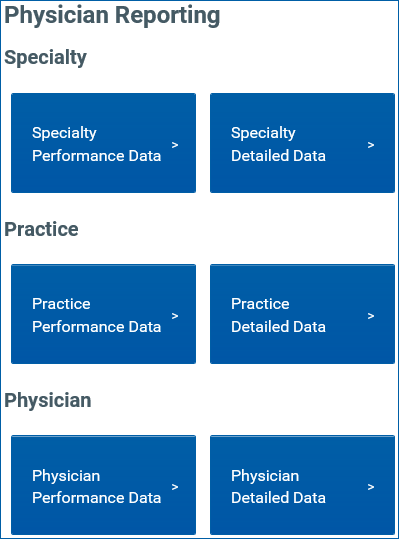
The dashboard also include a link to prioritize, by entity and department, the primary peer group used in dashboards, and activate only those peer groups to use for comparisons.
Analyze data at the specialty reporting level
- On the Comparative Analytics home page, click Physician Reporting.
-
On the Physician Reporting page, click Specialty Performance Data or Specialty Detailed Data.
-
Select filters; for example: period, entity, and practice specialty.
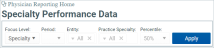
Specialty Performance Data filters (click to enlarge)
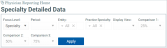
Specialty Detailed Data filters (click to enlarge)
-
Click Apply. For each specialty, the report displays the measure, current period, percentile comparisons, peer group, historical fiscal year total, and entity.
-
To export the report to Excel, click the Export button:


Analyze data at the practice reporting level
- On the Comparative Analytics home page, click Physician Reporting.
-
On the Physician Reporting page, click Practice Performance Data or Practice Detailed Data.
-
Select filters; for example: period, entity, and practice specialty.
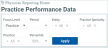
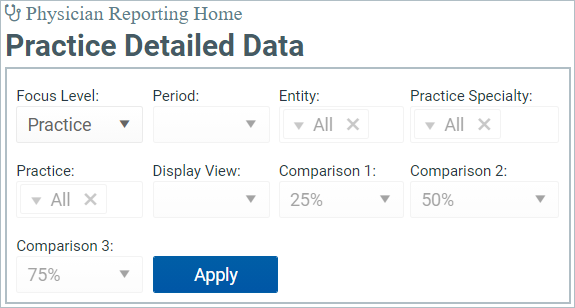
Practice Performance Data filters (click to enlarge)

Practice Detailed Data filters (click to enlarge)
-
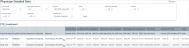
Click Apply. For each practice, the report displays the department number, measure, current period, percentile comparisons, peer group, historical fiscal year total, and entity.
-
To export the report to Excel, click the Export button:

Analyze data at the physician reporting level
- On the Comparative Analytics home page, click Physician Reporting.
-
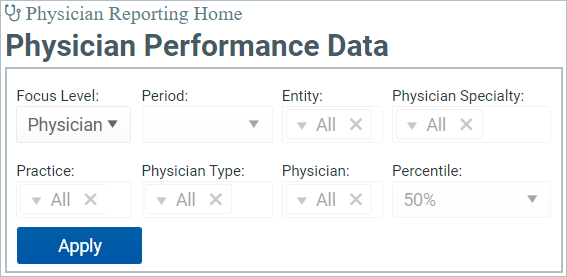
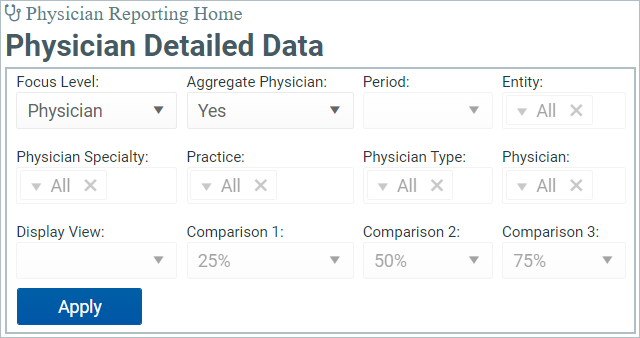
On the Physician Reporting page, click Physician Performance Data or Physician Detailed Data.
-
Select filters; for example, period, entity, physician specialty, practice, physician type (Physician or Non-Physician), and whether to aggregate physician records (that is, display total values, or display only the values for departments in which activity occurred).

Physician Performance Data filters (click to enlarge)

Physician Detailed Data filters (click to enlarge)
-
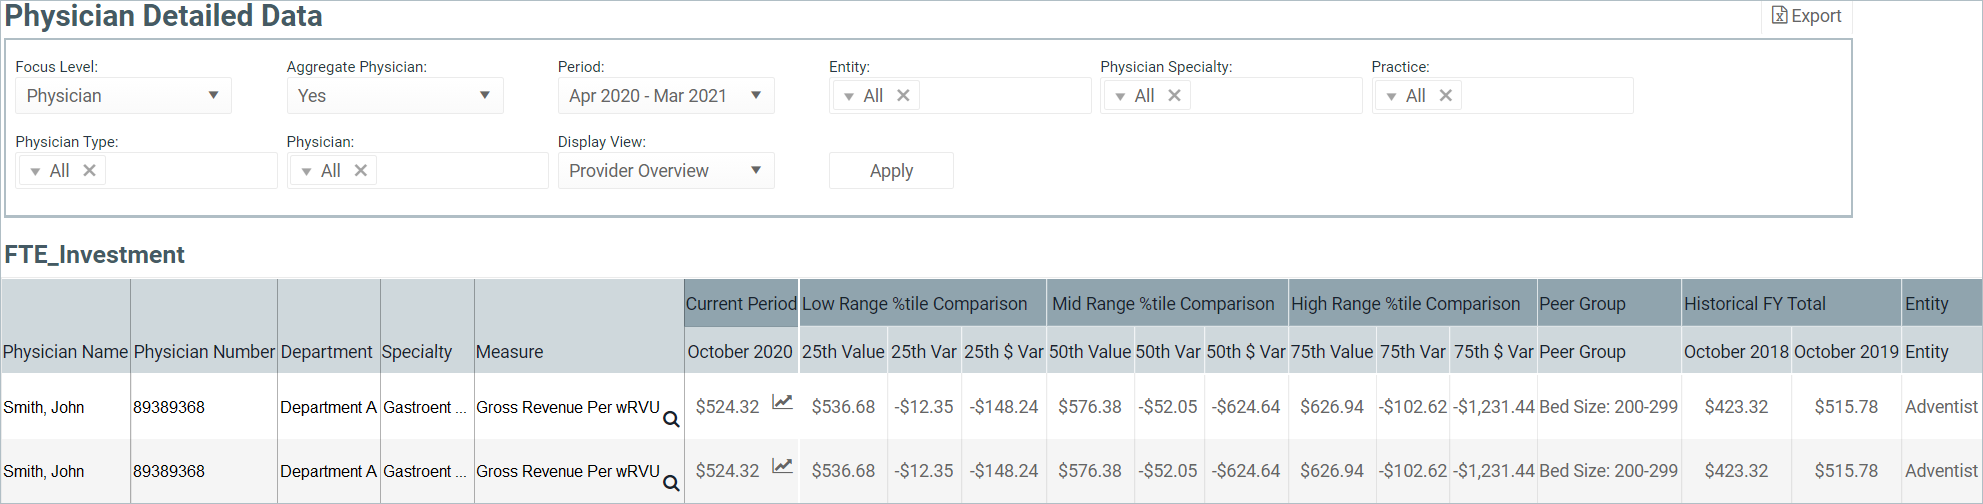
Click Apply. For each physician, the report displays the physician number, department, specialty, measure, current period, percentile comparisons, peer group, historical fiscal year total, and entity.
Physician Detailed Data report (click to enlarge)
-
To export the report to Excel, click the Export button: