AX1840
Once a web report is opened, you may have access to a variety of features to view and explore the data in the report, including filtering, sorting, and drilling.
Drilling data
If the web report has been configured to enable drilling, you can drill any data row in the report. Total rows, subtotal rows, and section header rows are not drillable.
To drill a data row:
-
Hover your cursor over the far left column in the report so that a magnifying glass icon appears on the row.
The tooltip for the magnifying glass will be either "Drill" (if multiple drill paths are available) or "Drill to <path>" (if a single drill path is available). For example, the tooltip will say "Drill to Acct" if the Acct drill path is the only available drill path.
- Click the icon to drill the row.
If multiple drill paths are available, these paths display in a menu when you click the icon. Select the drilling path that you want to view, and that path opens in a new browser tab.
If a single drill path is available, that path automatically opens in a new browser tab.
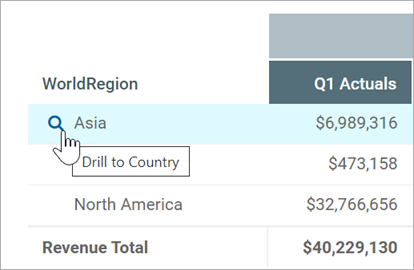
Hover and click to drill
The current row being drilled and the current drill level display at the top of the drill results. You can continue drilling the drill results if additional drill paths are available. Any additional drill results display in the same browser tab instead of opening a new tab. When you are finished viewing the drill results, you can close the browser tab and return to the original report.
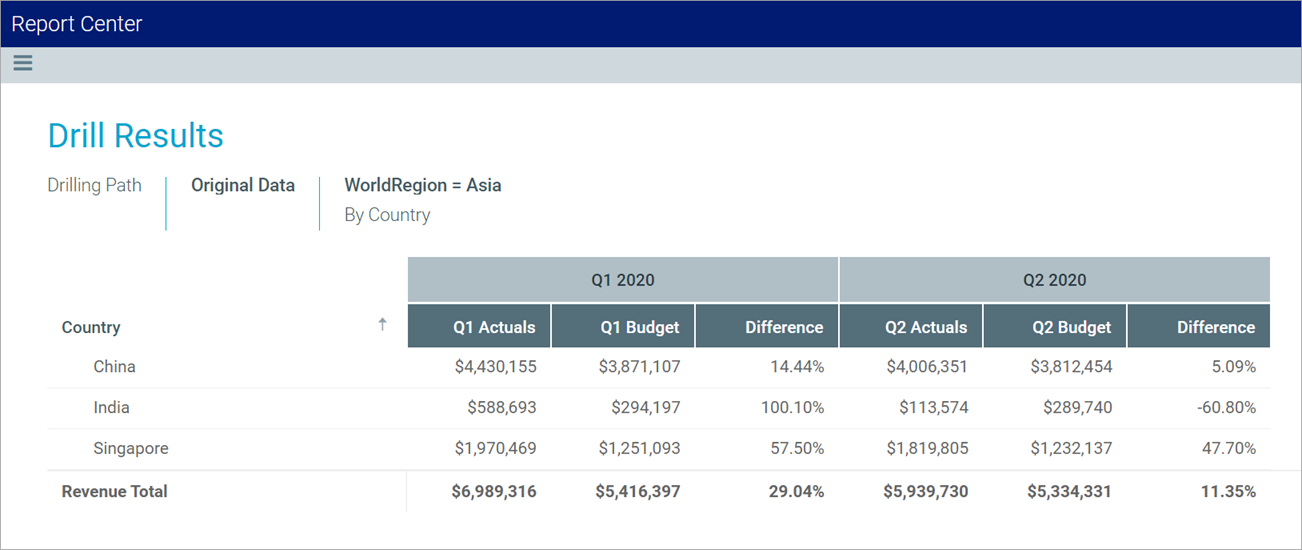
Example drill results with drilling path displayed at the top
Adjusting column width and order
You can make minor adjustments to the column display as follows:
-
To change the column width, hover your cursor along the right edge of the column header, then drag to make the column thinner or wider.
-
To reorder columns, click on a column header and then drag it to a new location. Note that columns cannot be moved in or out of a column group (meaning a set of columns grouped under header text). If a column belongs to a column group, you can change its order within the group but you cannot drag it out of the group. Additionally, row dimension columns cannot be reordered within data columns and vice versa.
Sorting data
If the web report uses a data grid with dynamic rows, then you can sort the data by any column in the grid. To sort the grid by a column, click on the column header. Each click toggles between ascending sort, descending sort, and no sort. If the grid is currently sorted by a column, the sort direction is indicated by an arrow on the column header (up for ascending, down for descending).
The web report may only allow sorting by a single column, or it may allow sorting by multiple columns. This is configured by the report designer. If the grid uses single-column sorting, then it is not possible to clear the sort on a column. Instead you must click on a different column to change the sort to use that column.
If the web report uses a fixed row structure, then the row values are fixed in position and may not be sorted.
Filtering by column data
If the web report uses a data grid with dynamic rows, you may be able to filter the report by the column data. For example, you might want to filter a column to hide zero-value records, or to show all records above or below a certain value. You might want to filter a dimension column to hide or show certain dimensions (such as departments, accounts, and so on). The report designer determines whether a column is enabled for filtering.
If a column allows filtering, the filter icon displays in the column header when you hover your cursor over the column header.
![]()
Filter icon for a column with filtering enabled
To filter the report based on a column:
- Click the filter icon in the column header to show the filter options.
-
Set the filter options as desired. You can set up to two filter options, combined with either AND or OR.
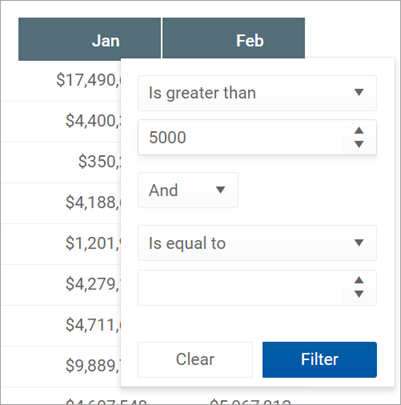
Example filtering options
- Click Filter.
The report updates to only show records that meet the filter. Additionally, the filter icon in the column header remains visible to indicate that the grid is filtered by this column.
The filter is retained until you clear it, or until the report is refreshed with new data.
To clear a filter:
- Click the filter icon in the column header to show the filter options.
- Click Clear.
The grid updates to clear the filter. The filter icon is now only visible when hovering over the column header.
Viewing paged data
If the web report uses dynamic rows, the data is paged to show a specified number of records per page. If the data in the grid exceeds the page limit, you can move between pages using the page controls at the bottom left of the grid.
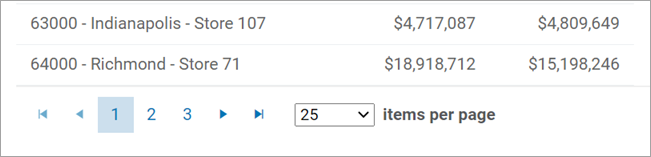
Page controls for data grids
- Click a page number to move directly to that page.
- Click the single arrow buttons to move one page back or forward.
- Click the double arrow buttons to move to the first page or the last page.
By default, the data grid shows 25 records per page. You can use the drop-down list next to the page controls to change this to 50, 100, or 500 as needed.
