AX1040
Defining report sections for a Fixed Report
The report sections of a Fixed Report component are defined using the FixedReportConfig data source. This topic explains how to use each row type of the data source to define a report section.
To use the Data Source Wizard to add the tags to a sheet, right-click in a cell and then select Create Axiom Form Data Source > Fixed Report. By default, the data source is populated with example row tags to define one header row, two data row sections with subtotals, one subtotal row, and one total row. You can complete the column properties for these row tags, add more row tags, and remove any row tags that you do not need.
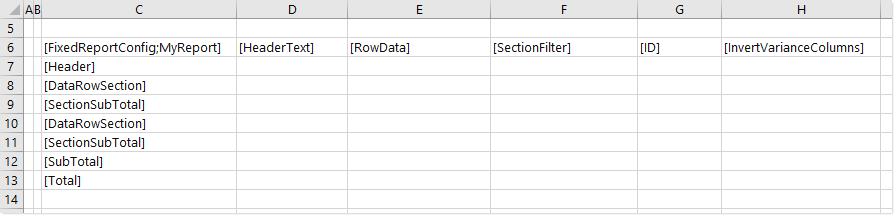
Newly-added FixedReportConfig data source with starting example row tags
The required and optional column properties, and the valid entries, differ depending on the row type. The following sections explain how to complete the column properties for each row type.
Creating header rows
To create a stand-alone header row, use the [Header] row tag. This tag is intended to be used to define top-level header text that is not associated with a particular data row section.
The column properties for the [Header] row tag should be completed as follows:
- [HeaderText]
-
Defines the header text to be displayed on the report row.
Overflow behavior for header text depends on whether columns are frozen. If columns are not frozen, then header text overflows into the adjacent column. If columns are frozen, then header text wraps. If the text wraps, then you must set the width of the [HeaderColumn] row as appropriate to fit the header text, within the FixedReportColumns data source.
All other column properties should be left blank, because they do not apply to [Header] rows.
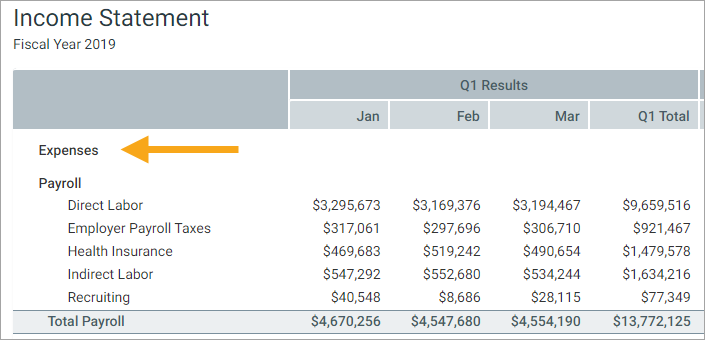
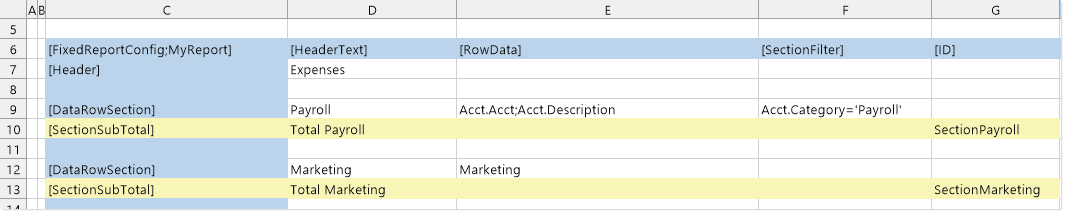
The following example shows a header row (highlighted in yellow) within the data source:
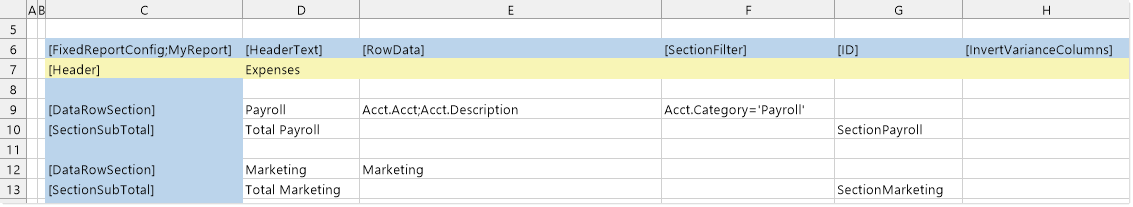
This row displays as follows in the rendered report:
Creating subheader rows
The FixedReportConfig data source supports a row tag of [SubHeader]. Generally speaking, this tag should not be used because:
-
Currently, [SubHeader] rows use the exact same formatting as [Header] rows. Since there is no effective difference, the [Header] row should be used for stand-alone header rows.
-
If the subheader is intended to be the label for a particular data row section, then it is not necessary to use a separate row tag for this purpose. If you define [HeaderText] for a data row section, this text will display directly above the data row section as its section label. See the next section for more information.
If you do decide to use a [SubHeader] row, it should be completed the same as [Header] rows (as described in the previous section).
Creating data row sections
To create a section of data rows, use the [DataRowSection] row tag. This tag is intended to define a related set of data rows. These rows display together within the report, with an optional section subheader and section subtotal.
The column properties for the [DataRowSection] row tag should be completed as follows:
- [HeaderText]
-
Optional. Defines header text for the data row section. This text is displayed directly above the data rows in the section.
Overflow behavior for this header text is the same as described here.
- [RowData]
-
Required to define the rows in the section. Rows can be generated dynamically, or you can define a fixed set of rows.
-
Dynamic: You can generate rows dynamically based on the values in a specified column. For example, if the specified column is Acct.Acct, and the section filter is Acct.Category='Payroll', then the section will have a data row for each payroll account. This approach is essentially the same as specifying a column as the "sum by" level for an Axiom query, except that the sum by level applies to this section only instead of the entire report.
Use the following syntax to generate rows dynamically:
ValueColumns; LabelColumnOrDisplayFormat; SortColumn; ContraExpression
Only the first parameter is required, to specify the column (or columns) to use to generate the rows in the section. All other parameters can be used as needed.
-
ValueColumns: List one or more columns using Table.Column syntax. Separate multiple columns with commas. The columns must be valid for use as the "sum by" level, based upon the primary table specified in the component properties. The same columns that would be valid to use as the sum by level for an Axiom query are valid here. For more information, see Defining the sum level for an Axiom query. For example:
Acct.Acct generates a row for each account that matches the section filter.
Acct Acct,Dept.Dept generates a row for each account and department combination that matches the section filter.
-
LabelColumnOrDisplayFormat: Optional. If defined, the data row section uses alternate row labels for each row, based on a specified label column or a defined display format. For example:
Acct.Acct; Acct.Description displays the values from the Description column on each row instead of the Acct values.
Acct.Acct; {Acct.Acct} ({Acct.Description}) displays the Acct value followed by the Description value in parentheses on each row.
Acct.Acct,Dept.Dept; {Acct.Description} - {Dept.Description} displays the Acct Description value and Dept Description value on each row, separated by a hyphen.
If this parameter is omitted, then each row displays the values from the value column. If multiple value columns are specified, the values are concatenated with commas.
-
SortColumn: Optional. Specifies an alternate Table.Column by which to sort the row values. You can also specify the sort order by indicating asc or desc (ascending is used by default if omitted). For example:
Acct.Acct; Acct.Description; Acct.Order desc sorts rows by the Acct.Order column in descending order.
Acct.Acct; ; Acct.Order also sorts rows by the Acct.Order column (this time in ascending order), but in this example the second parameter is not defined, so it must be included but left blank.
If the SortColumn parameter is omitted, then the rows are sorted by the label values if defined, otherwise by the column values.
-
ContraExpression: Optional. Defines a conditional expression to designate "contra account" rows within the section. Any rows that match the conditional expression have their values subtracted from the section subtotal instead of added. For example:
Acct.Acct; {Acct.Acct} ({Acct.Description}); ; Acct.Credit='C' means that any row in this section with C in the Credit column will be treated as a contra account and subtracted from the section subtotal. Note that if you want to define a contra expression but you are not using either of the second or third parameters, you must still include the unused parameters but leave them blank. In this example, the third parameter is unused so it is left blank.
If the ContraExpression parameter is omitted, then all rows are subtotaled as normal. For more information, see Designating certain rows as "contra accounts".
-
Fixed: If the rows that you want to display in the section cannot be automatically generated, then you can use a FixedReportSectionConfig data source to define the rows instead. In that case, enter the name of the data source here.
- [SectionFilter]
-
Optional. Specifies a filter to limit the data brought into a section.
If the data row section uses a Table.Column to define the rows in the section, then the section filter impacts both the data to be brought into the section and the rows to display in the section. For example, if [RowData] is set to Acct.Acct and the section filter is Acct.Category='Marketing', then the section will only contain rows for accounts assigned to the Marketing category.
If the data row section uses a FixedReportSectionConfig data source to define the rows, then the section will always contain a row for each row defined in the data source. If the section filter means that no data is available for a particular row, then that row is not omitted—instead, it will display with zero values.
NOTE: Section filters should be specific to the rows in each particular section. If you want to apply an overall filter to the entire report, then you should define a filter at the component level instead, using the Data Filter in the Fixed Report component properties.
- [ID]
-
Optional. Defines an ID for the data row section, so that it can be referenced in subtotal and total rows. Subtotals and totals use these IDs to determine the data to be included in the calculation.
NOTE: If the data row section has an associated section subtotal row, you can define the ID on either the [DataRowSection] row or the [SectionSubtotal] row. Either approach will allow the rows in this section to be included in a subtotal or total calculation.
- [InvertVarianceColumns]
-
Optional. Specifies whether to perform sign reversal on calculated columns that are designated as variance columns in the FixedReportColumns data source (using the [IsVarianceColumn] property). For more information on this feature, see Using sign reversal for variance columns.
If set to True, then values in variance columns are multiplied by -1 to reverse the number sign from positive to negative (or vice versa), for the current section. When enabled for a data row section, the sign reversal also automatically applies to the associated [SectionSubtotal] row (if present).
The following example shows two data row sections defined within the data source.
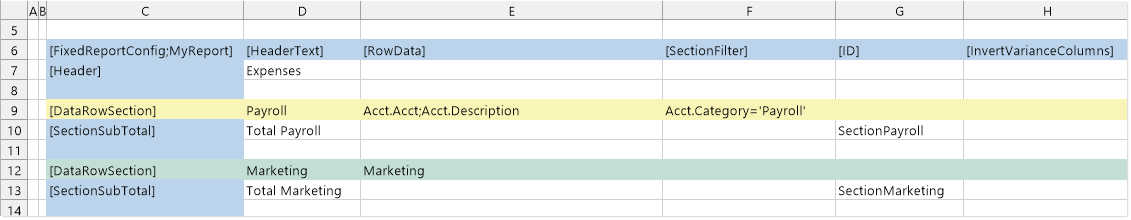
-
The first section, highlighted in yellow, is a dynamic section. The rows in this section will be dynamically generated based on values in the Acct.Acct column, filtered to only show accounts that are assigned to a category of Payroll. Additionally, the row labels will use the Acct.Description value instead of the Acct.Acct value.
-
The second section, highlighted in green, is a fixed section. The rows in this section are defined in a separate FixedReportSectionConfig data source, such as the following:
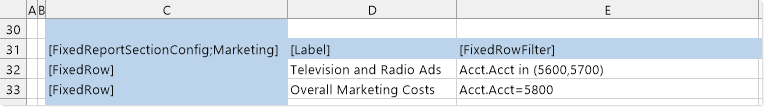
There are a variety of reasons why you might want to use fixed rows instead of dynamically generating the rows. In this example, we want to combine two accounts on one of the rows.
-
Both sections have defined header text, so a subheader will display at the top of each section, introducing the data rows.
-
Neither section has a defined ID. This is because we have chosen to use an ID on the section subtotal rows instead.
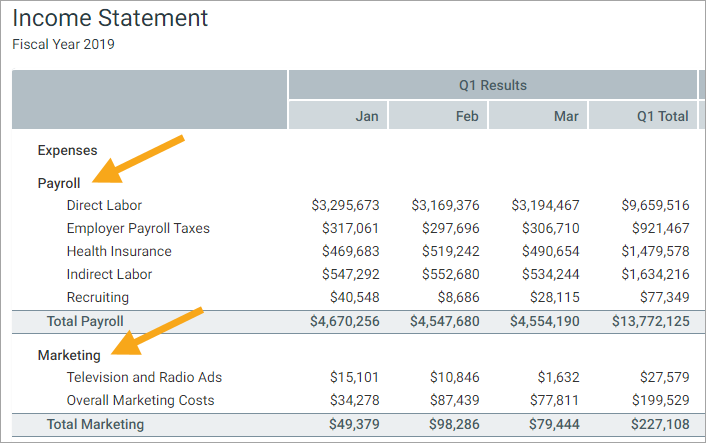
These data row sections display as follows in the rendered report:
Creating subtotal rows for a data row section
To display a subtotal for a data row section, use the [SectionSubTotal] row tag. This tag should be placed directly below the [DataRowSection] tag that you want to subtotal, so that a subtotal row displays at the bottom of the data row section. You can also optionally place the [SectionSubTotal] tag directly above the [DataRowSection] tag, if you prefer to display the section subtotal row at the top of the data row section instead of at the bottom.
The column properties for the [DataRowSection] row tag should be completed as follows:
- [HeaderText]
-
Optional. Defines the label text to be displayed on the subtotal row.
Overflow behavior for this header text is the same as described here.
- [RowData]
-
This property is only required if the [SectionSubTotal] tag is placed above the [DataRowSection] tag. When using this configuration, enter the ID of the data row section to subtotal. Otherwise, if the [SectionSubTotal] tag is placed below the [DataRowSection] tag (the default behavior), then the section subtotal row is automatically associated with the above data row section so it is not necessary to specify an ID.
If the data row section that is being subtotaled contains exactly two rows, then you can enter the keyword Subtract here in order to subtract the 2nd row from the 1st row (instead of adding the rows). If the subtotal row is below the data row section, then you can enter the Subtract keyword by itself. If the subtotal row is above the data row section, then you can append the keyword to the section ID with a semicolon—for example: Section1;Subtract.
- [ID]
-
Defines an ID for this section subtotal row, so that it can be referenced in other subtotal and total calculations.
For example, you may have three data row sections that display different categories of expenses, and each one has its own section subtotal row. If you want to display the total for these three sections, you can use a standalone [Subtotal] or [Total] row, and then reference the IDs for all three sections in the calculation. The calculation can reference an ID set on either the [SectionSubTotal] row or the [DataRowSection] row. Either ID will have the same result, with one exception—if the section subtotal row uses the Subtract keyword, then you must use the ID set on the section subtotal row in order to include the result of the subtraction in the calculation.
Generally speaking, it is not necessary to enable [InvertVarianceColumns] for section subtotal rows, because it will automatically apply to the section subtotal if it is enabled for the data row section.
The following example shows two section subtotal rows defined within the data source. Both are placed immediately below their corresponding data row section, so there is no need to enter a data row section ID into the [RowData] property. Both section subtotal rows have defined IDs, because we plan to reference these IDs in an expenses subtotal row (see next section).
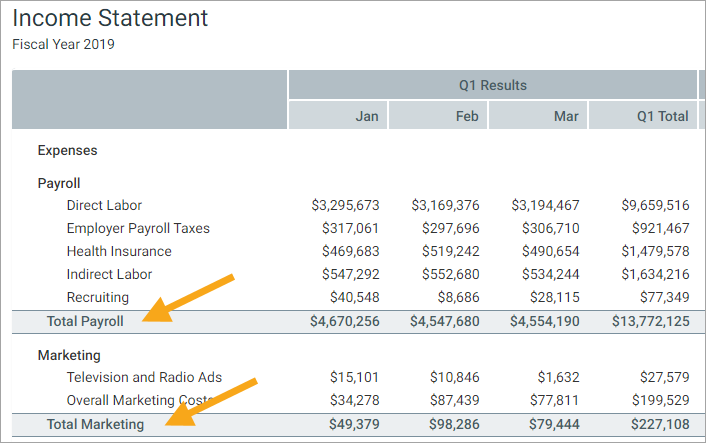
These section subtotal rows display as follows in the rendered report:
Creating stand-alone subtotal rows
To create a stand-alone subtotal row, use the [SubTotal] row tag. This tag is intended to display a subtotal of multiple data row sections and/or other subtotals. The stand-alone subtotal row is formatted the same way as a section subtotal row, but with slightly more spacing.
The column properties for the [SubTotal] row tag should be completed as follows:
- [HeaderText]
-
Optional. Defines the label text to be displayed on the subtotal row.
Overflow behavior for this header text is the same as described here.
- [RowData]
-
Required to specify the data row sections and/or subtotals to include in the calculation, and the type of calculation.
Enter an expression that adds and/or subtracts two or more data row sections and/or subtotals, referenced by their ID as defined in the [ID] column. For example:
Section1 + Section2
Subtotal1 - Subtotal2
Subtotal1 + Subtotal2 - Subtotal3
Each expression can use addition (+) and/or subtraction (-). Parentheses cannot be used in the expression.
- [ID]
-
Defines an ID for this subtotal row, so that it can be referenced in other subtotal and total calculations.
- [InvertVarianceColumns]
-
Specifies whether to perform sign reversal on calculated columns that are designated as variance columns in the FixedReportColumns data source (using the [IsVarianceColumn] property). If set to True, then values in variance columns are multiplied by -1 to reverse the number sign from positive to negative (or vice versa). For more information on this feature, see Using sign reversal for variance columns.
NOTE: Stand-alone subtotal rows that reference a section or subtotal with an inverted variance are not automatically inverted. If you want the inversion to also apply to the subtotal, you must enable it on the subtotal row.
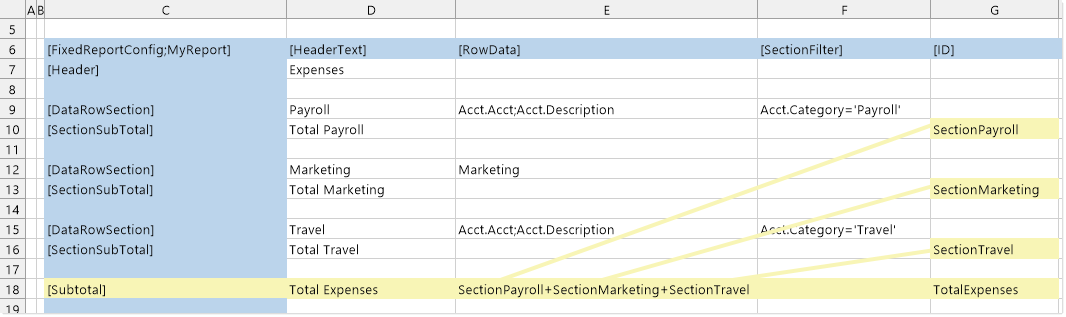
The following example shows a stand-alone subtotal row defined within the data source. Because this row is intended to display a subtotal of all expenses, the calculation in the [RowData] property references the IDs defined on each section subtotal row. (The same result could be obtained from defining and referencing IDs on the data row sections instead.) An ID is defined for the subtotal row, because we intend to reference it in the final total calculation.
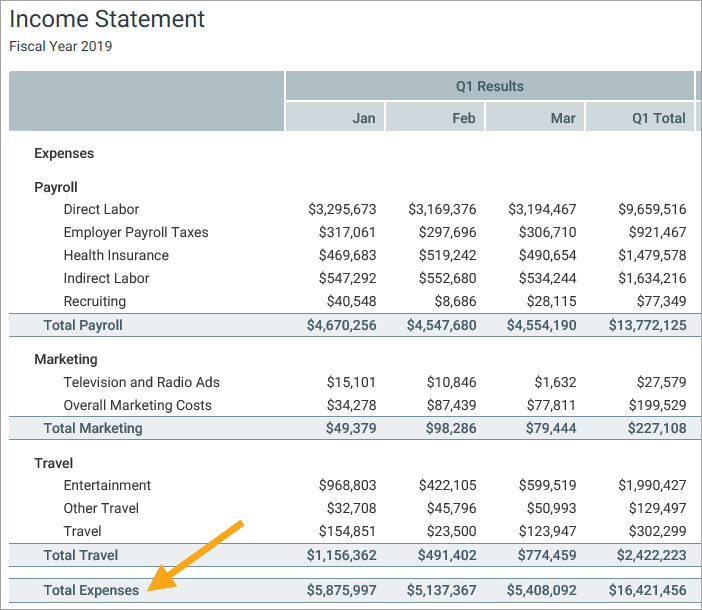
The subtotal row displays as follows in the rendered report:
Creating total rows
To create a total row, use the [Total] row tag. This tag is intended to display a final total for the report. The total row is formatted slightly differently than subtotal rows.
The column properties for the [Total] row tag should be completed as follows:
- [HeaderText]
-
Optional. Defines the label text to be displayed on the total row.
Overflow behavior for this header text is the same as described here.
- [RowData]
-
Required to specify the data row sections and/or subtotals to include in the calculation, and the type of calculation.
Enter an expression that adds and/or subtracts two or more data row sections and/or subtotals, referenced by their ID as defined in the [ID] column. For example:
Section1 + Section2
Subtotal1 - Subtotal2
Subtotal1 + Subtotal2 - Subtotal3
Each expression can use addition (+) and/or subtraction (-). Parentheses cannot be used in the expression.
- [InvertVarianceColumns]
-
Specifies whether to perform sign reversal on calculated columns that are designated as variance columns in the FixedReportColumns data source (using the [IsVarianceColumn] property). If set to True, then values in variance columns are multiplied by -1 to reverse the number sign from positive to negative (or vice versa).
NOTE: Total rows that reference a section or subtotal with an inverted variance are not automatically inverted. If you want the inversion to also apply to the total, you must enable it on the total row.
Generally speaking, it is not necessary to define an [ID] for total rows, because there is typically only one and it is not referenced in any other calculation. However, if you have a report configuration that uses multiple total rows, you can define an ID to reference the total in other calculations.
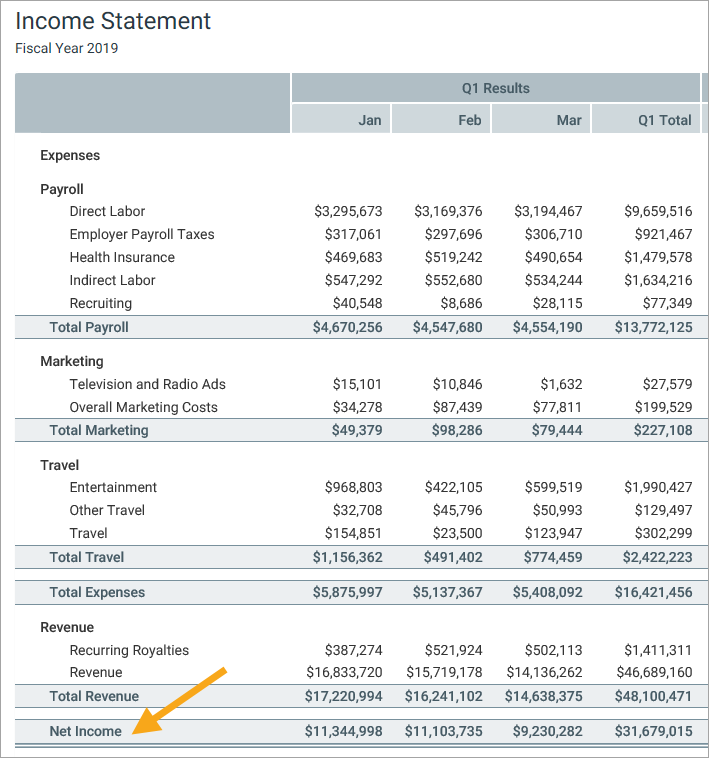
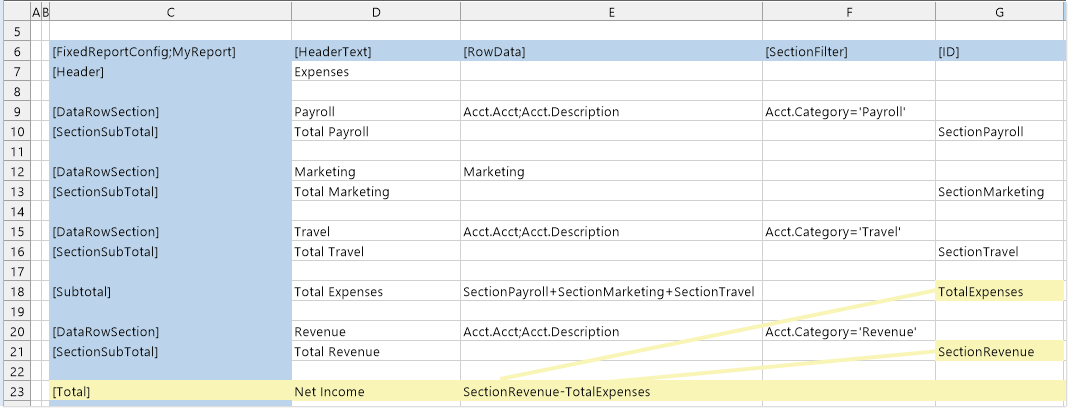
The following example shows a total row defined within the data source. Because this row is intended to display the total of revenue minus expenses, the calculation in the [RowData] property references the IDs defined on the expenses subtotal row and the revenue section subtotal.
The total row displays as follows in the rendered report: