AX1040
Defining report sections for a Fixed Report
The report sections of a Fixed Report component are defined using the FixedReportConfig data source. This topic explains how to use each row type of the data source to define a report section.
To use the Data Source Wizard to add the tags to a sheet, right-click in a cell and then select Create Axiom Form Data Source > Fixed Report. By default, the data source is populated with example row tags to define one header row, two data row sections with subtotals, one subtotal row, and one total row. You can complete the column properties for these row tags, add more row tags, and remove any row tags that you do not need.
![]()
Newly-added FixedReportConfig data source with starting example row tags
The required and optional column properties, and the valid entries, differ depending on the row type. The following sections explain how to complete the column properties for each row type.
Creating header rows
To create a stand-alone header row, use the [Header] row tag. This tag is intended to be used to define top-level header text that is not associated with a particular data row section.
The column properties for the [Header] row tag should be completed as follows:
All other column properties should be left blank, because they do not apply to [Header] rows.
The following example shows a header row (highlighted in yellow) within the data source:
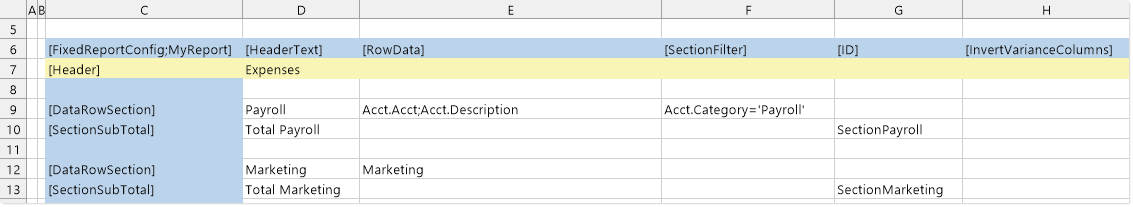
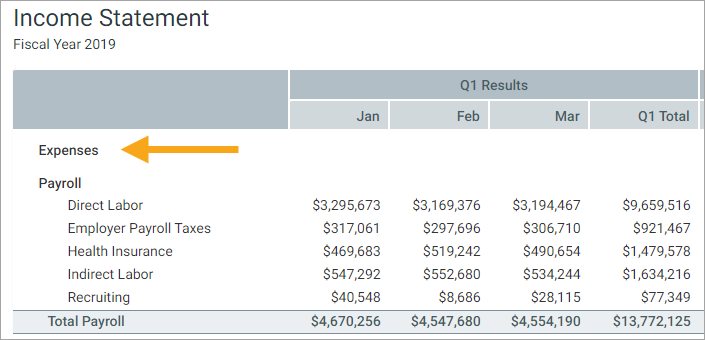
This row displays as follows in the rendered report:
Creating subheader rows
The FixedReportConfig data source supports a row tag of [SubHeader]. Generally speaking, this tag should not be used because:
-
Currently,
[SubHeader]rows use the exact same formatting as[Header]rows. Since there is no effective difference, the[Header]row should be used for stand-alone header rows. -
If the subheader is intended to be the label for a particular data row section, then it is not necessary to use a separate row tag for this purpose. If you define
[HeaderText]for a data row section, this text will display directly above the data row section as its section label. See the next section for more information.
If you do decide to use a [SubHeader] row, it should be completed the same as [Header] rows (as described in the previous section).
Creating data row sections
To create a section of data rows, use the [DataRowSection] row tag. This tag is intended to define a related set of data rows. These rows display together within the report, with an optional section subheader and section subtotal.
The column properties for the [DataRowSection] row tag should be completed as follows:
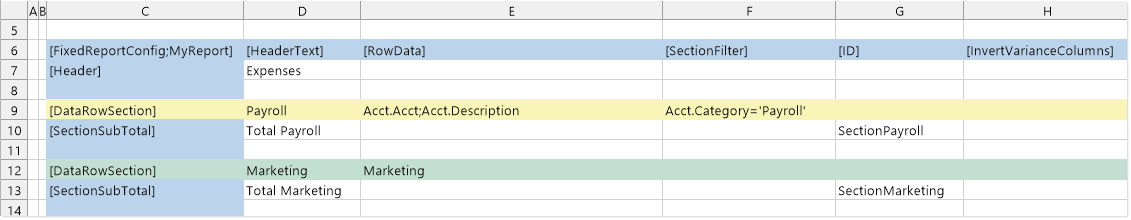
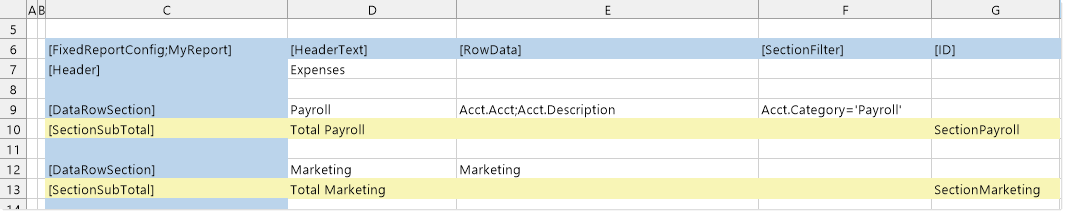
The following example shows two data row sections defined within the data source.
-
The first section, highlighted in yellow, is a dynamic section. The rows in this section will be dynamically generated based on values in the Acct.Acct column, filtered to only show accounts that are assigned to a category of Payroll. Additionally, the row labels will use the Acct.Description value instead of the Acct.Acct value.
-
The second section, highlighted in green, is a fixed section. The rows in this section are defined in a separate FixedReportSectionConfig data source, such as the following:
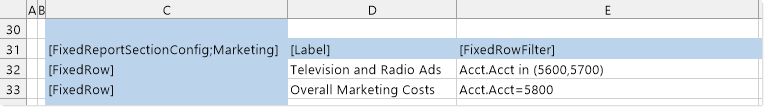
There are a variety of reasons why you might want to use fixed rows instead of dynamically generating the rows. In this example, we want to combine two accounts on one of the rows.
-
Both sections have defined header text, so a subheader will display at the top of each section, introducing the data rows.
-
Neither section has a defined ID. This is because we have chosen to use an ID on the section subtotal rows instead.
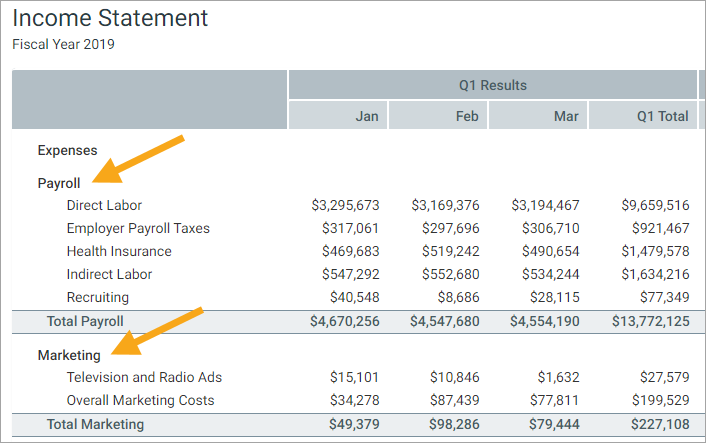
These data row sections display as follows in the rendered report:
Creating subtotal rows for a data row section
To display a subtotal for a data row section, use the [SectionSubTotal] row tag. This tag should be placed directly below the [DataRowSection] tag that you want to subtotal, so that a subtotal row displays at the bottom of the data row section. You can also optionally place the [SectionSubTotal] tag directly above the [DataRowSection] tag, if you prefer to display the section subtotal row at the top of the data row section instead of at the bottom.
The column properties for the [DataRowSection] row tag should be completed as follows:
Generally speaking, it is not necessary to enable [InvertVarianceColumns] for section subtotal rows, because it will automatically apply to the section subtotal if it is enabled for the data row section.
The following example shows two section subtotal rows defined within the data source. Both are placed immediately below their corresponding data row section, so there is no need to enter a data row section ID into the [RowData] property. Both section subtotal rows have defined IDs, because we plan to reference these IDs in an expenses subtotal row (see next section).
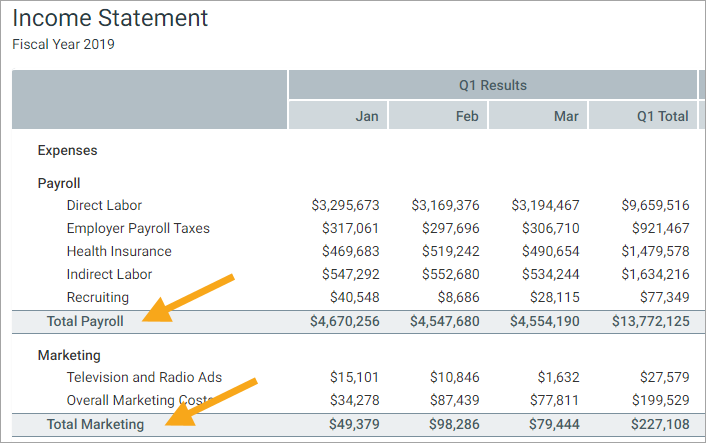
These section subtotal rows display as follows in the rendered report:
Creating stand-alone subtotal rows
To create a stand-alone subtotal row, use the [SubTotal] row tag. This tag is intended to display a subtotal of multiple data row sections and/or other subtotals. The stand-alone subtotal row is formatted the same way as a section subtotal row, but with slightly more spacing.
The column properties for the [SubTotal] row tag should be completed as follows:
The following example shows a stand-alone subtotal row defined within the data source. Because this row is intended to display a subtotal of all expenses, the calculation in the [RowData] property references the IDs defined on each section subtotal row. (The same result could be obtained from defining and referencing IDs on the data row sections instead.) An ID is defined for the subtotal row, because we intend to reference it in the final total calculation.
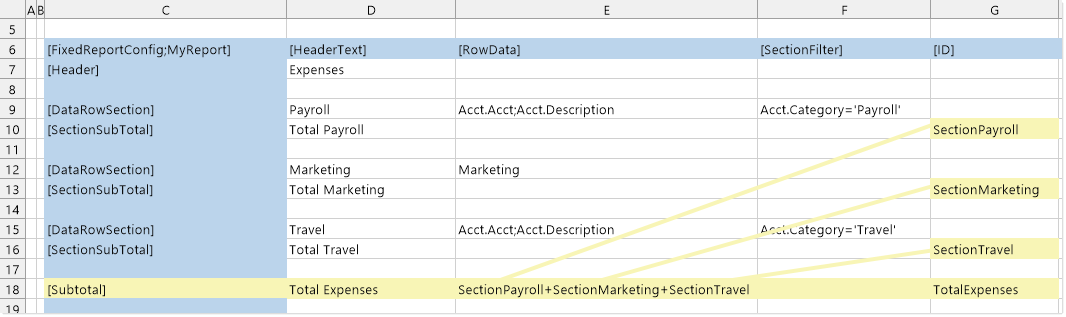
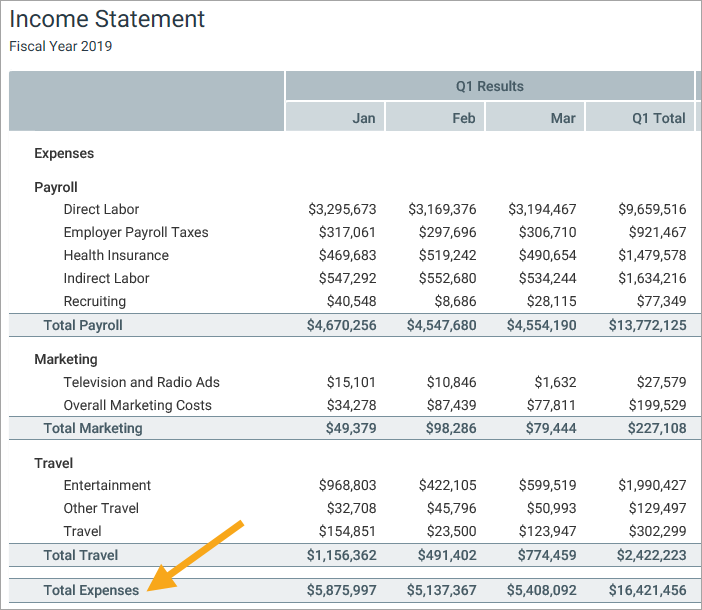
The subtotal row displays as follows in the rendered report:
Creating total rows
To create a total row, use the [Total] row tag. This tag is intended to display a final total for the report. The total row is formatted slightly differently than subtotal rows.
The column properties for the [Total] row tag should be completed as follows:
Generally speaking, it is not necessary to define an [ID] for total rows, because there is typically only one and it is not referenced in any other calculation. However, if you have a report configuration that uses multiple total rows, you can define an ID to reference the total in other calculations.
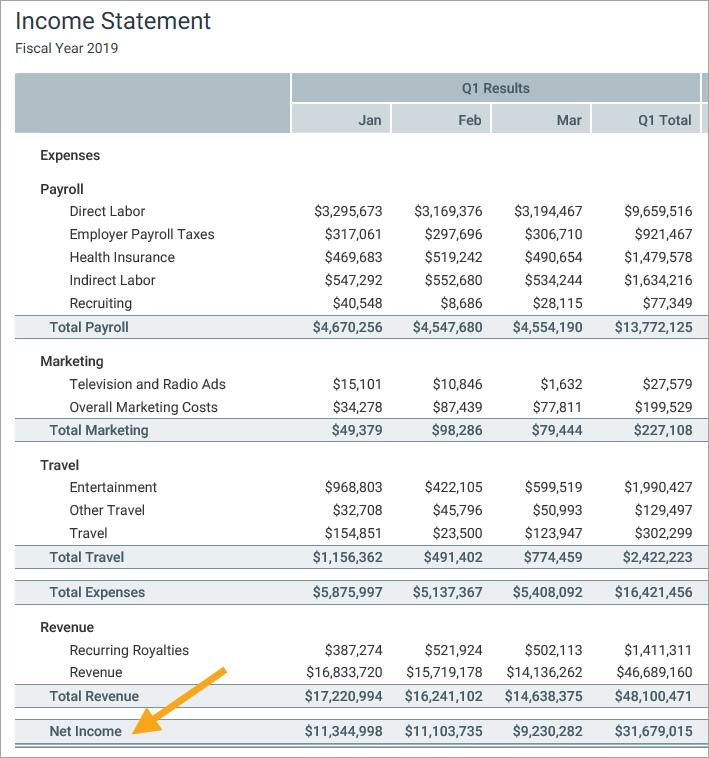
The following example shows a total row defined within the data source. Because this row is intended to display the total of revenue minus expenses, the calculation in the [RowData] property references the IDs defined on the expenses subtotal row and the revenue section subtotal.
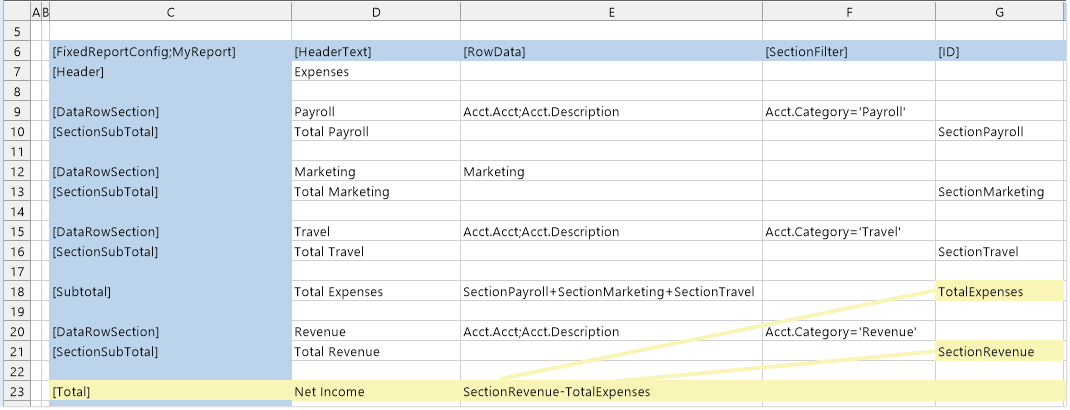
The total row displays as follows in the rendered report: