AX1674
When you open a web report, it is automatically refreshed to show a predefined set of data. Depending on the report configuration, you may have the option to dynamically change the data shown in the report. If you have any questions about what you can do or see in a particular report, ask your system administrator or other local system contact.
Interacting with web report data
-
Data Grids: Web reports may contain a data grid to display data. You can use the built-in data grid features to interact with the data, such as expanding / collapsing groups, filtering columns, sorting data, and more. For more information on what you can do in a data grid, see Using data grids in web reports.
-
KPIs: Web reports may contain a series of boxes showing key performance indicators. If the box has an icon in the top right corner, you can click the icon to open a web page or an Axiom file relating to the KPI.
-
Filters: Web reports may be designed so that you can filter the data in the report on demand, based on a predefined set of filter options. If the filter icon is present in the toolbar, you can use the Filters panel to change the data shown in the report. For more information on using the Filters panel, see Filtering data in web reports.
Advanced options
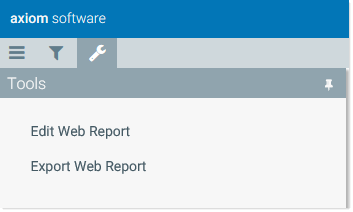
If you have read/write access to the web report, the following options are available from the Tools menu while you are in the report:
-
Edit Web Report: Open the current report in the Report Builder for editing. For more information, see Using the Report Designer.
-
Export Web Report: Download a copy of the AWR report file. Generally speaking, you would only use this to import the report into a different Axiom Budgeting & Performance Reporting system, or for troubleshooting purposes when working with Axiom Support.
