AX2331
Report Wizard: Creating a free-form fixed rows report
Using the Report Wizard, you can create a free-form report with fixed rows. The Free Form - Fixed Rows report allows you to:
-
Select a single dimension for the rows. You can specify which items in the dimension to include in the rows and their order.
The row structure of the report is fixed and will not automatically adjust for subsequent additions or deletions to the selected dimension. For example, if the dimension is ACCT.Category and a new category is later added to the ACCT table, this report will not automatically include a row for that category.
- Select any data for the columns. You can also apply a dimension to the column data. For example, you can have a report that contains a column (or columns) for each department or region, for a particular data point.
The Free Form - Fixed Rows report includes totals by row and by column. No other calculations are included in the report.
NOTE: This report uses GetData functions to bring data into the report. Please keep in mind that Axiom queries can also be used to create fixed-row reports, using the "update only" refresh behavior. In many cases the Axiom query construction may be the preferred option, because the data query performance is typically faster.
To create a free-form fixed rows report:
- On the Axiom tab, in the Reports group, click Reports > Report Wizard.
- For Choose a report style, select Free Form - Fixed Rows, and then click Next.
-
For Choose the rows for the report, select a dimension to define the grouping level ("sum by") for the report, and then click Next.
-
For Dimension: select the dimensional grouping to use for the rows. By default, the report will have one row for each item in the grouping. You can double-click the box or click the Choose dimension icon
 to select a dimension column. You can select from any reference table.
Each row in the report will be summed at the selected level. For example, if you select ACCT.ACCT, then each row will be for an individual account. If you select ACCT.Category, then each row will contain the sum for all of the accounts in a category.
- You can choose whether to Use all values of the selected dimension (the default), or to Manually select values. If you choose to manually select values, then all values listed in the Selected Values box will have a row in the report, in the order listed. You can adjust the order of these items by using the arrow buttons above the box.
-
-
For Choose columns to display, specify the data to display in the columns, and then click Next. There are two options to determine the report's columnar structure:
 Select one or more columns (default)
Select this option if you want to specify multiple data columns to display in the report, such as four quarterly total columns, or twelve months of budget data.
- In the Available Columns list, navigate to the columns that you want to use. You can select from any data table or reference table.
-
To select the desired columns, you can double-click the column name or you can click the Add button. If a column is added in error, select it and then click Remove.
TIP: If you want to add all columns in a table, select the table name and then click Add.
- In the resulting report, the columns will be displayed in the order listed in the Selected Columns box. You can adjust the order by using the arrow buttons above the box.
Repeat data with dimension filters
Select this option if you want the columns to display data by a particular dimensional grouping—for example, show YTD data by department, region, or VP. You can use this to compare data for all items in a dimension or dimensional grouping.
-
For Data, select a single data column to define the data for the report. You can double-click the box or click the Choose column icon
to select a column. You can select from any data table that uses the selected row dimension.NOTE: The Report Wizard limits the data selection to one column for simplicity. It is possible to manually create reports that use any number of data columns per dimensional grouping.
- For Dimension: select the dimensional grouping to use for the columns. The report will have one column for each item in the grouping. You can double-click the box or click the Choose dimension icon to select a dimension column. You can select from any reference table that the data table links to.
- Specify whether to Use all values of the selected dimension grouping, or to Manually select values. If you choose to manually select values, then all values listed in the Selected Values box will have a column in the report, in the order listed. You can adjust the order of these items by using the arrow button above the box.
For example, if you choose the alias CYA_YTD for the data, and DEPT.Region for the dimension, then the report will have one column for each region, showing the CYA_YTD data for each region.
NOTE: The column structure created by the Report Wizard is not dynamic—meaning, the dimension elements will be "hard-coded" into the columns and will not automatically update if dimension elements are added or deleted in the future. It is possible to manually create a report with a dynamic columnar structure using a horizontal Axiom query. For more information, see Using horizontal Axiom queries.
If you do not want to specify any other report options, you can click Finish at this point to create the report.
-
Optional. For Specify a filter, define a filter to limit the data in the report, and then click Next. You can type the filter or use the Filter Wizard
 .
.The filter will be added as a sheet filter to the report. You can always edit the report later to apply a filter if you do not want to apply one now.
-
For Choose report options, specify any report options that you want to apply to the report, and then click Finish.
These are all standard report options. If you do not select them now, you can enable them later using the Sheet Assistant or the Control Sheet.
The report is created according to your selections. You can now modify it as desired.
NOTE: Depending on the total number of GetData functions in the generated report, it may take some time to initially open and calculate.
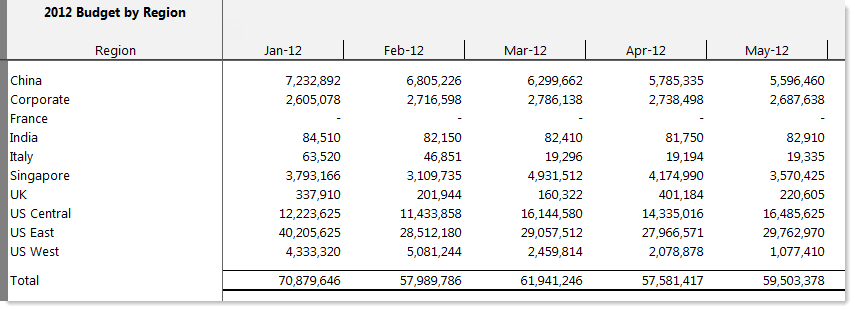
Free-form fixed rows report example
The following is an example of a report generated using the free-form fixed rows option.