AX2330
Report Wizard: Creating a free-form dynamic rows report
Using the Report Wizard, you can create a free-form report with dynamic rows. The Free Form - Dynamic Rows report allows you to:
-
Select up to two dimensions to dynamically populate the rows. If two dimensions are selected, the first dimension is grouped by the second dimension—for example, accounts subtotaled by account categories.
The row structure of this report is dynamic and will automatically adjust for subsequent additions or deletions to the selected dimension. For example, if the dimension is ACCT.ACCT and new accounts are later added to the ACCT table, this report will automatically update to include new rows for those accounts. (Assuming that the new accounts meet any filter applied to the report, and that the query is still configured to rebuild or insert data.)
- Select any data for the columns. You can also apply a dimension to the column data. For example, you can have a report that contains a column (or columns) for each department or region, for a particular data point.
The Free Form - Dynamic Rows report does not contain any row-based calculations. Full-column totals or section subtotals are included.
To create a free-form dynamic rows report:
- On the Axiom tab, in the Reports group, click Reports > Report Wizard.
- For Choose a report style, select Free Form - Dynamic Rows, and then click Next.
-
For Choose the rows for the report, select a grouping dimension to define the rows and optionally a subtotal dimension, and then click Next.
-
For Choose a dimension or grouping column to define the rows, select the column to define the sum level of the rows. You can select from any reference table in the system. You can double-click inside the box to bring up the column chooser, or you can click the Choose dimension icon
 to the right of the box.
For example, if you choose ACCT.ACCT, then each individual row will contain the data for a single account. If you choose ACCT.Category, then each individual row will contain the data summed by account categories.
-
Optionally, you can select a second dimension by which to group and subtotal the rows of the first dimension. To do this, select the Use subtotal sections check box. Then for Choose a dimension or grouping column to define the sections, select the column that you want to use. The same rules apply as when selecting the first dimension.
For example, if you choose ACCT.ACCT as the grouping dimension and then ACCT.Category as the subtotal dimension, then the report will display with accounts listed under their respective categories. A subtotal is included for each category section.
The following additional options are available for the row dimensions:
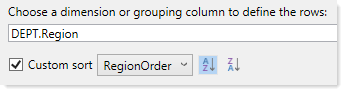
 Custom sort
By default, the selected dimensions are sorted in ascending order. If desired, you can specify a Custom sort to change the order to descending, or even to specify a different grouping column to use for the sort.
If this check box is selected for a dimension, then the following new options display to the right of the check box:
-
Sort column: Select the column to sort by. By default, this is the same column chosen as the dimension. You can change this to a different column if desired.
For example, you may want to display regions in your report, but those regions should display in a different order than alphabetical by region. You could have another column in the table such as RegionOrder which defines the sort order for the regions.
-
Ascending / descending: You can click the Sort ascending or Sort descending buttons to the right of the column selection to determine the sort order.
Insert new sections on refresh
The option Insert new sections on refresh determines how the subtotal groupings will be created. This option is only available if you have selected a subtotal dimension.
- If selected, then the subtotal groupings are created by using nested Axiom queries. The first query dynamically builds out a second query with a data range for each subtotal section. Therefore if new items are added to the subtotal dimension (or old items removed), the query will adjust automatically when refreshed.
- Otherwise, the subtotal groupings are created using a single Axiom query with a data range for each section. These data ranges are static and will not adjust for future additions or deletions to the subtotal dimension.
For example, imagine you have a report with accounts subtotaled by account categories. A few months later, a new account category is added to your system. If Insert new sections on refresh was selected, then when the report is refreshed, the nested query is dynamically rebuilt and a new section (data range) is automatically added for the new category.
If Insert new sections on refresh was not selected, then the query sections are static and the new category is not included when the report is refreshed. The report will not contain data for any accounts that were assigned to that new category. You would need to manually adjust the report to add a data range for the new category.
NOTE: This assumes that the refresh settings and basic query structure of the original report were left as is after the report was created. The Insert new sections on refresh option only determines how the report is originally structured—once created, the report can be adjusted as needed.
-
-
For Choose columns to display, specify the data to display in the columns, and then click Next. There are two options to determine the report's columnar structure:
Select one or more columns (default)
Select this option if you want to specify multiple data columns to display in the report, such as four quarterly total columns, or twelve months of budget data.
- In the Available Columns list, navigate to the columns that you want to use. You can select from any data table or reference table.
-
To select the desired columns, you can double-click the column name or you can click the Add button. If a column is added in error, select it and then click Remove.
TIP: If you want to add all columns in a table, select the table name and then click Add.
- In the resulting report, the columns will be displayed in the order listed in the Selected Columns box. You can adjust the order by using the arrow buttons above the box.
Repeat data with dimension filters
Select this option if you want the columns to display data by a particular dimensional grouping—for example, show YTD data by department, region, or VP. You can use this to compare data for all items in a dimension or dimensional grouping.
-
For Data, select a single data column to define the data for the report. You can double-click the box or click the Choose column icon
to select a column. You can select from any data table that uses the selected row dimension.NOTE: The Report Wizard limits the data selection to one column for simplicity. It is possible to manually create reports that use any number of data columns per dimensional grouping.
- For Dimension: select the dimensional grouping to use for the columns. The report will have one column for each item in the grouping. You can double-click the box or click the Choose dimension icon to select a dimension column. You can select from any reference table that the data table links to.
- Specify whether to Use all values of the selected dimension grouping, or to Manually select values. If you choose to manually select values, then all values listed in the Selected Values box will have a column in the report, in the order listed. You can adjust the order of these items by using the arrow button above the box.
For example, if you choose the alias CYA_YTD for the data, and DEPT.Region for the dimension, then the report will have one column for each region, showing the CYA_YTD data for each region.
NOTE: The column structure created by the Report Wizard is not dynamic—meaning, the dimension elements will be "hard-coded" into the columns and will not automatically update if dimension elements are added or deleted in the future. It is possible to manually create a report with a dynamic columnar structure using a horizontal Axiom query. For more information, see Using horizontal Axiom queries.
If you do not want to specify any other report options, you can click Finish at this point to create the report.
-
Optional. For Specify a filter, define a filter to limit the data in the report, and then click Next. You can type the filter or use the Filter Wizard
 .
.The filter will be added as a sheet filter to the report. You can always edit the report later to apply a filter if you do not want to apply one now.
-
For Choose report options, specify any report options that you want to apply to the report, and then click Finish.
These are all standard report options. If you do not select them now, you can enable them later using the Sheet Assistant or the Control Sheet.
The report is created according to your selections. You can now modify it as desired.
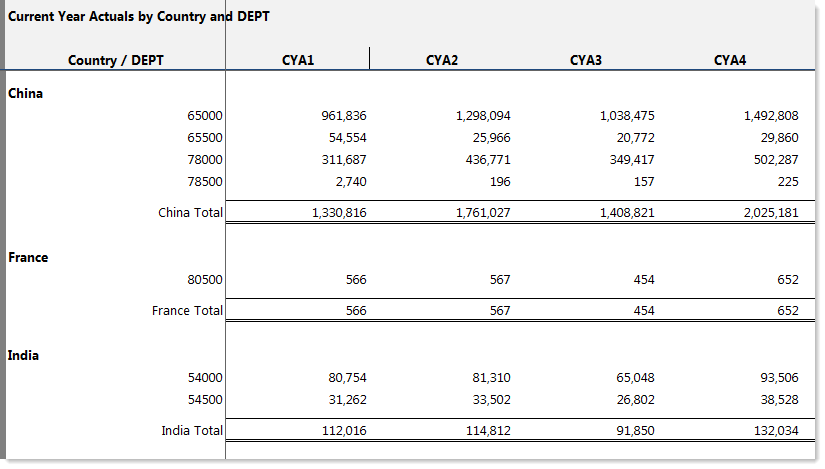
Free-form dynamic rows report example
This example uses the option to define two row dimensions for subtotal groupings. The "base" dimension is DEPT and the subtotal dimension is DEPT.Country.