Visualize the impact of the COVID-19 patient population
Why use this feature
The COVID-19 population definitions combined with the COVID-19 Population and Utilization Analysis Dashboard help your organization understand and visualize the impact of the COVID-19 patient population.
How this feature works
There are two key features to the new COVID-19 reporting capability:
NOTE: For clients using Axiom Decision Support 2019.3 and 2019.4, you can contact Axiom Support to request this report.
1. COVID-19 patient population definitions
The new Population Builder utility allows you to create and manage population definitions, including specifying criteria. The tagged encounters can then be pushed to Axiom Intelligence for reporting purposes. As part of the 2020.1 release, we included the following pre-defined population definitions specific to COVID-19:
- COVID-19 Cases
- COVID-19 Deaths
- Exposure to COVID-19
- Signs & Symptoms of COVID-19
These population definitions were used to create the new COVID-19 Population and Utilization Analysis Dashboard, but you can also reconfigure these definitions to meet your needs and/or use them to create and customize other Axiom Intelligence reports.
Where: In the DSS Admin task pane, in the Encounter Grouper and Care Continuum section, double-click Launch Population Builder.
Who: DSS Administrators or DSS Analysts (DSS Report Writers).
How: Add a definition by clicking Add Population Definition at the top of the Population Definitions home page. Edit or clone a definition by clicking the definition to highlight it, and then click the notepad icon. Configure the definition, including adding criteria, and save it. To process this definition individually, click Process, or to process multiple active definitions at the same time, on the Population Definitions home page, click Process Active Definitions.
|
|
Click here to watch a video demonstration |
2. COVID-19 Population and Utilization Analysis Dashboard
This dashboard report allows you to monitor ongoing and dynamic changes to volume and demographics related to the COVID-19 patient population while also tracking utilization activity and cost of critical resources across your organization. This dashboard includes the following reports:
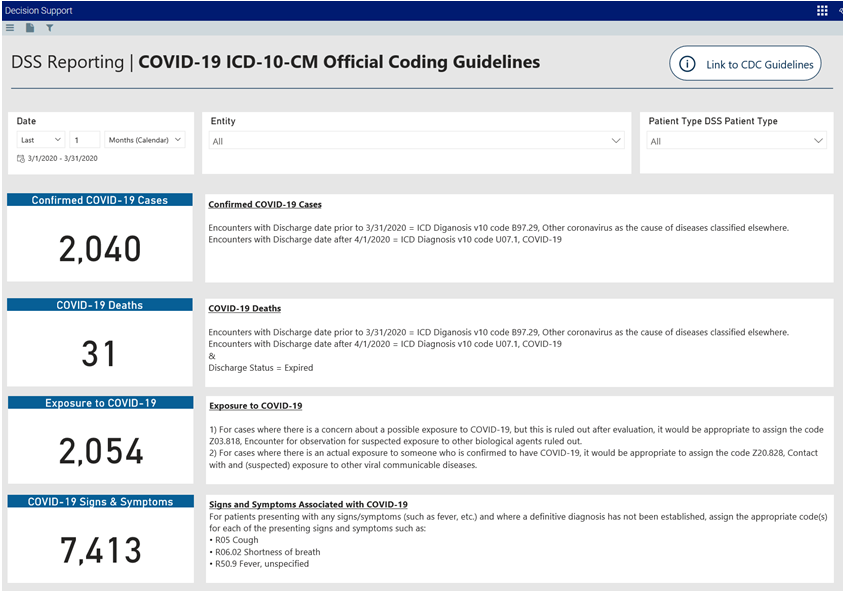
- COVID-19 ICD-10-CM Coding Guidelines - Serves as the main home page for the dashboard and includes the following Key Performance Indicators (KPIs) as well as a link to the CDC Guidelines used to create these populations:
- Confirmed COVID-19 Cases
- COVID-19 Deaths
- Exposure to COVID-19
- Signs and Symptoms Associated with COVID-19

Click image to view full size
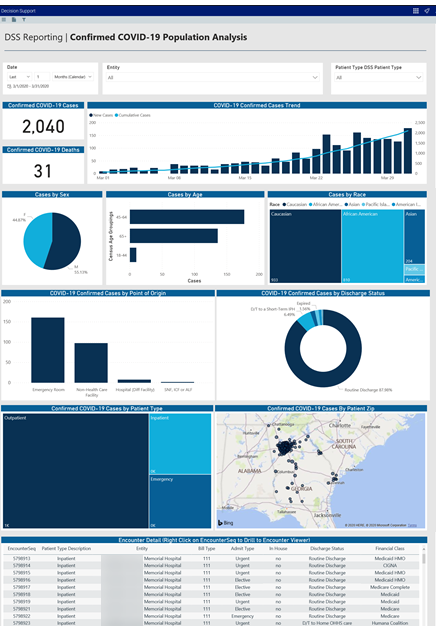
-
COVID-19 Population Analysis report - Allows you to monitor the ongoing and dynamic changes to volumes and understand these new populations across demographic, geographic, and operational sectors.

Click image to view full size
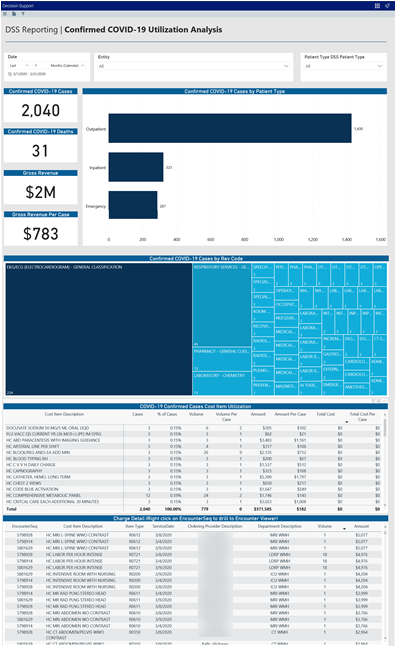
-
COVID-19 Utilization Analysis report - Allows you to quickly investigate and drill into various aspects of the COVID-19 populations to better understand the utilization activity and cost of critical resources such as beds, equipment, drugs, and supplies. This insight is key to both resourcing in the short term and planning for the future.

Click image to view full size
Where: In the Axiom Intelligence Reports section, click COVID-19 Population & Utilization Analysis.
Who: DSS Administrators or DSS Analysts (DSS Report Writers).
How: After opening the dashboard, use the Slicer section at the top of the page to select the date, entity, and patient type variables in which to configure the data to display. At the bottom of the page, click the COVID-19 Population Analysis tab or the COVID-19 Utilization Analysis tab. Hover your mouse over different areas of the report sections to view details. For tables, right-click a line item to drill down to more information.
|
|
Click here to watch a video demonstration |
Where to find more information
The following topics in the online help include instructions on using Axiom Intelligence:
