New DAX measures for improved health plan network reporting
Why use this feature
You can now build Axiom Intelligence dashboards for health plan networks to accurately understand volumes, determine patient severity, and pinpoint improvements to length of stay for your organization. The following new measures include the following:
- Cases with Gross Charges greater than - Identify cases that have gross charges greater than zero versus all cases
- Case Mix Index (CMI) - Determine the CMI of a given population
- GeometricLOS - Identify the Geometric Length of Stay
- Difference between ALOS and GeomLOS (opportunity) - Compare your organization’s ALOS and GeomLOS at a MSDRG and service line level and identify your opportunity or difference between these two measures
How this feature works
What:
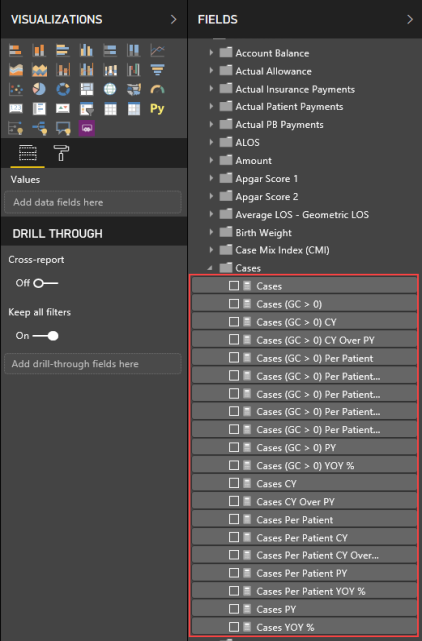
- Cases (New base measure folder) * Field Description = Sum of Cases with Gross Charges greater than Zero
- Cases (GC>0)
- Cases (GC>0) CY
- Cases (GC>0) CY Over PY
- Cases (GC>0) Per Patient
- Cases (GC>0) Per Patient CY
- Cases (GC>0) Per Patient CY Over PY
- Cases (GC>0) Per Patient PY
- Cases (GC>0) Per Patient YOY%
- Cases (GC>0) PY
- Cases (GC>0) YOY%
- Case Mix Index (CMI) (New base measure folder) * Field Description = Sum of MSDRG weight for each discharge divided the total by the number of discharges
- CMI
- CMI CY
- CMI PY
- CMI CY over PY
- CMI YOY %
- Geometric Mean LOS (GMLOS) (New base measure folder) * Field Description = Calculated by multiplying all of the lengths of stay and then taking the nth root of that number.
- GMLOS
- GMLOS CY
- GMLOS PY
- GMLOS CY over PY
- GMLOS YOY %
- Average LOS - Geometric LOS (New base measure folder) * Field Description = Difference between Average LOS and Geometric LOS
- ALOS - GMLOS
- ALOS - GMLOS CY
- ALOS - GMLOS PY
- ALOS - GMLOS CY over PY
- ALOS - GMLOS YOY %
Where: The new measures are included in the Model Measures folder in Axiom Intelligence.
Who: DSS Administrators or DSS Analysts
How: From the Axiom Decision Support home page, click the Navigation icon in the far-left corner of the page, and click Report Designer. In the Fields section, click Model Measures > DSS Measures. Drag and drop the appropriate measures into the data visualization area to build your dashboard or report.
Where to find more information
The following topics in the online help include instructions on using Axiom Intelligence:
