AX1759
In the Report Designer, you can browse all of the Axiom Intelligence reports that are available to you, and open them to view report data using business intelligence tools and visualizations. In order to open an Axiom Intelligence report, you must have at least read-only access to the report, as defined in Axiom Decision Support security. Axiom Intelligence reports can be opened from either the Web Client or the Desktop Client General term for using either the Excel Client or the Windows Client, both of which are installed to the user's desktop..
This topic discusses the default way to access and view Axiom Intelligence reports. Your system may be designed so that you can open these reports in other ways, such as:
- Using the Navigation panel in the Web Client
- Using links within your home page or other files
- Using links within a task pane or ribbon tab in the Desktop Client
Opening an Axiom Intelligence report using the Web Client
You can open Axiom Intelligence reports using the Report Designer page in the Web Client.
To access the Report Designer page:
-
Click the menu icon
 in the left side of the Task Bar The gray bar that displays across the top of browser-based Axiom files, as well as various feature pages of the Web Client. The Task Bar provides access to various tasks that are specific to the current area, page, or document. to open the Navigation panel. Then, select Report Designer.
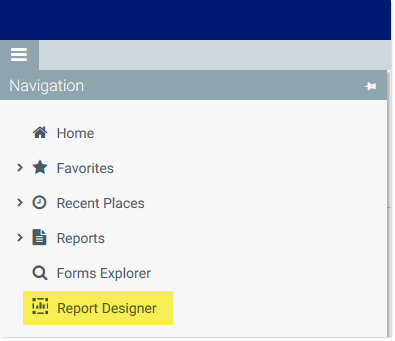
NOTE: If you do not see the Report Designer in the Navigation panel, this may mean that your organization's Navigation panel has not been updated (or that your organization has customized the panel to exclude it).
Alternatively, you can go to directly to the Report Designer page as follows:
|
Example On-Premise URL |
http://ServerName/Axiom/Reports Where ServerName is the name of the Axiom Application Server, and Axiom is the default name of the virtual directory. |
|
|
Example Cloud System URL |
https://ClientName.axiom.cloud/Reports Where ClientName is the name of your Axiom Cloud Service system. |
All of the Axiom Intelligence reports that you have permission to access are listed underneath the Axiom Intelligence Reports header. To open a report, click on it.
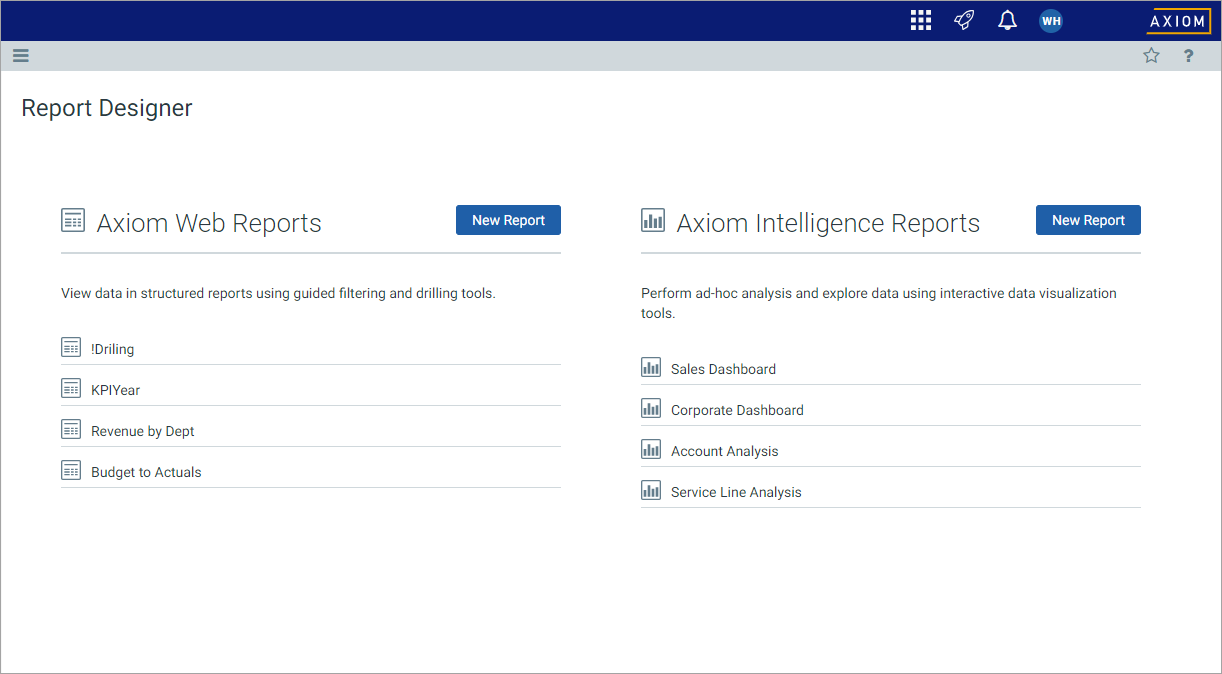
Example Report Designer page
Reports are displayed in last-modified order, with the most recently created or modified reports on top. You can hover your cursor over a report to see when the report was last modified and by whom.
Opening an Axiom Intelligence report using the Desktop Client
You can open Axiom Intelligence reports from the Reports Library in the Desktop Client (Excel Client or Windows Client). You can differentiate Axiom Intelligence reports from other types of Axiom Decision Support reports using the following icons:
|
|
Axiom form | |
|
|
Axiom Intelligence report | |
|
|
Web report | |
|
|
Spreadsheet Axiom file |
To open an Axiom Intelligence report:
-
On the Axiom tab, in the Reports group, click Reports to bring up the Reports menu.
NOTE: In systems with installed products, this feature may be present on a different ribbon tab, such as the Main tab.
TIP: You can also open reports from the Explorer task pane or Axiom Explorer.
-
Use the Reports Library folders at the bottom of the menu to navigate to the specific report that you want to open, and then click on it.
The Axiom Intelligence report opens in the Web Client using your default browser.
Viewing data in an Axiom Intelligence report
When you open an Axiom Intelligence report, it displays a configured set of Axiom Decision Support data using visualizations. Visualizations are items such as charts, tables, maps, matrices, and KPIs. The report may contain other visual elements for navigation, drilling, and filtering.
Depending on the report configuration, you can explore and filter the data using features such as:
- Filtering: Data can be filtered in various ways.
You can use the Filters pane along the right-hand side of the screen to filter the entire report, the current report page, or the currently selected visualization. These filters may be saved in the report, or you can apply new filters as needed using the Filter Library panel.
Selecting a field in a visualization can filter other visualizations that use the same field.
The report may contain drop-down lists, slicers, or other visual elements that can be used to filter data.
-
Drilling: Visualizations can be associated with hierarchies, so that you can drill down the hierarchy to see the visualization data at different levels.
-
Bookmarks: You can use bookmarks to view designated areas of interest and apply predefined filters. Click the Show Report Bookmarks icon
 to show the Bookmarks panel, and then select from defined bookmarks (if present).
For more information on what you can do when viewing a report, see the Power BI documentation.
NOTE: Data in Axiom Intelligence reports is not live. Recent changes to Axiom Decision Support data may not be available in Axiom Intelligence reports if the data has not been synchronized. For more information on how Axiom Intelligence data is managed, see Managing data for Axiom Intelligence reporting.
Changing the color theme for an Axiom Intelligence report
Axiom Intelligence reports use a specified color theme in visualizations and other report elements. When viewing an Axiom Intelligence report, you can change the color scheme as needed. Changing the color scheme to use a different set of colors may make it easier to review certain visualizations.
When an Axiom Intelligence report is open in viewing mode, any color scheme changes only apply to the current report session. If you want to change the default color scheme for the report, you must make the change in the report editor and save the report.
-
Click the Report Settings icon
 in the Web Client Task Bar The gray bar that displays across the top of browser-based Axiom files, as well as various feature pages of the Web Client. The Task Bar provides access to various tasks that are specific to the current area, page, or document..
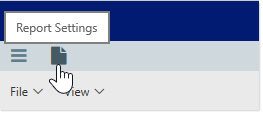
-
In the Report Settings panel, select the desired theme.
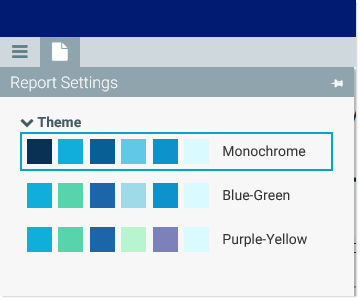
The report updates to use the specified theme.
