Executive Inpatient Service Line Trend page
Overview
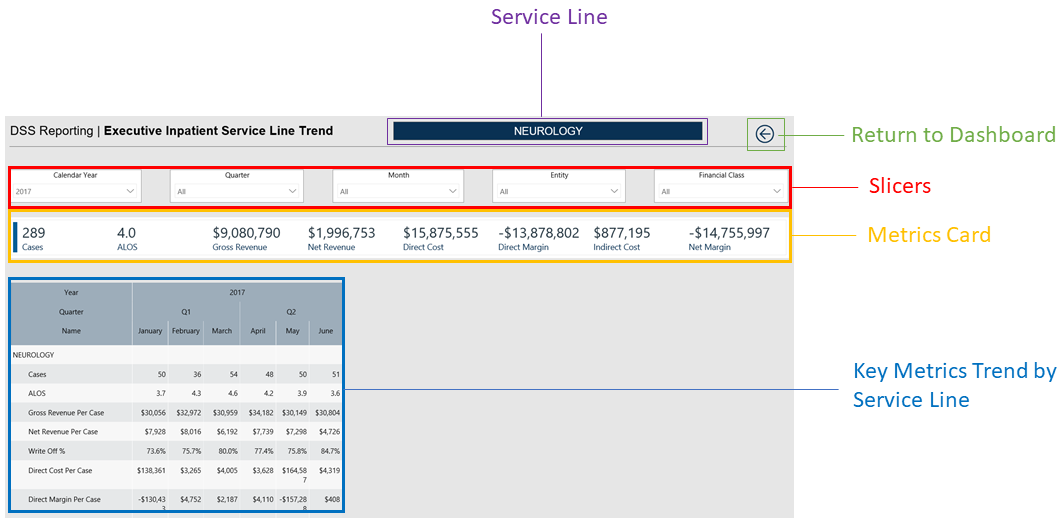
This page provides trend details for a specific service line selected in the Inpatient Service Line Dashboard.
The top of the page displays the service line the page applies to. To return to the Inpatient Service Line Dashboard, click the arrow in the upper right corner.
Click image to view full size
The following sections describe the different areas of this page.
Slicers
This section allows you to filter data by time (calendar year, quarter, month), entity, and financial class. From the drop-downs, you can select a combination of the available options to configure the parameters to include in the views.

Click image to view full size
Metrics Card
This section displays KPI data for visits, gross and net revenue, direct and indirect cost, and direct and net margin. As you select different columns or rows in the Key Metrics Trend table, the totals in the Metrics Card adjust accordingly.
Click image to view animated GIF full size
Key Metrics Trend by Service Line
This section displays the values related to profitability for the corresponding service line indicated at the top of the page. From this section, you can click a column or row to view the metric values for that specific row or column. As you click a column, the other columns will gray out to indicate that the information in the Metrics Card is specific to that column.
